S&P 500 futures barely budged following disappointing GDP data showing a miss with 1.2% vs 2.5% expected. We simply saw a fractional pullback on the S&P 500 Index (INDEXSP:.INX) before the stock market quickly found support and moved higher.
Digging deeper into GDP data… The consumer is doing very well, logging in at 4.2%. But housing investment and business investment are down, both worse than expected.
The dour GDP data news came after the Bank of Japan underwhelmed the market’s expectations. But again, the market seems to shrug it off. Europe is rising, seeing gains from Barclays, UBS and the Italian bank Monte dei Paschi di Siena ahead of Stress test results due later today.
The Bank of Japan’s decision to avoid further QE follows recent decisions by ECB and BOE decisions to hold off on easing… an initial disappointment on not taking rates further negative was later seen as a good move, with the Nikkei 225 closing up 0.50% after early 1% losses. The USDJPY is still lower and has dropped down to 103ish while Crude oil has also traded lower. Crude oil has now retraced 61.8% of Jan-June rally.
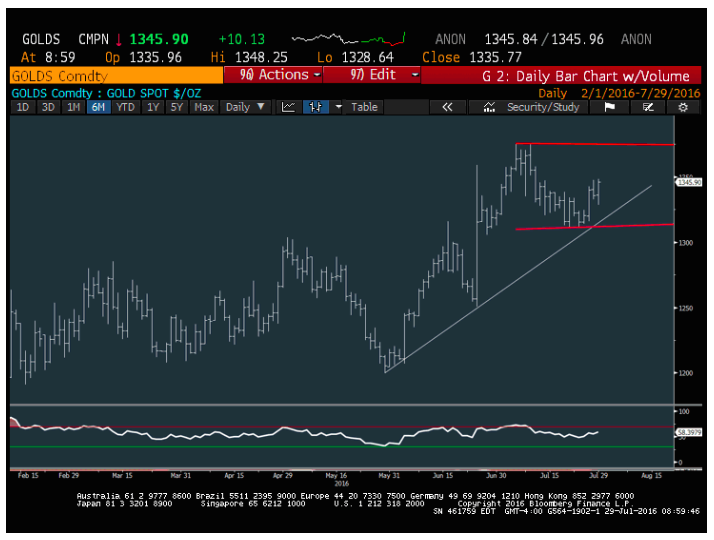
Gold (NYSEARCA:GLD) is jumping today as treasury yields are falling alongside the US Dollar Index. Today’s gold rally snuck above the prior days highs which could trigger a test of the overall rally highs. $1375 will be very important for Gold.
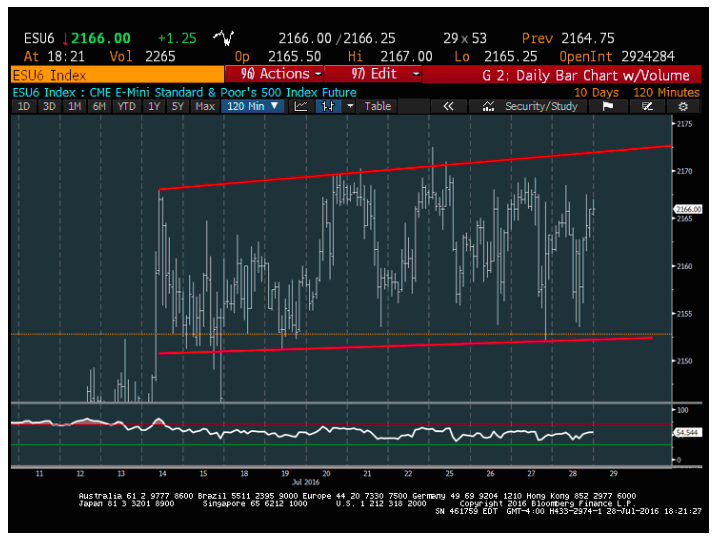
S&P 500 Futures
The key for the S&P 500 is holding the lows of the last 10 days right near 2150. On the upside, bulls will need to take out 2175-80. It won’t pay to anticipate a breakout until prices actually make the move. It’s been a very underwhelming trend for stock market Bulls and Bears alike since mid-July.
Gold
The Gold rally today coincided with the U.S. Dollar and treasury yields turning lower. $1375 will be a very important price area to watch for Gold prices. Getting up above that level allows for potential gains up to 1485-1500. That would be a huge move – likely to carry into September. But for now, its important to keep this range in mind as shown in the chart. $1375 on the upside and $1312 on the downside.
Thanks for reading and have a great weekend.
Twitter: @MarkNewtonCMT
The author may have a position in mentioned securities at the time of publication. Any opinions expressed herein are solely those of the author, and do not in any way represent the views or opinions of any other person or entity.


