 By Andrew Nyquist
It’s January and the “off-to-the-races” theme is in full effect again. Similar to last year, the S&P 500 has exploded higher and left in its wake of a stream of bears and assorted market chasers and followers. On the same hand, however, it is good to note that the markets can only go so far, so fast, before experiencing a dip or pullback. And further to this point, the S&P 500 have been running higher for almost a month now without a dip beyond 1 percent. And this has pushed me into the near-term cautious camp.
That said, let’s turn to the charts for a better idea of where the markets are at. Looking at the daily chart of the S&P 500 (see below), it’s easy to see that the index is overbought and has gone vertical of late. I’m not as concerned about the overbought status, as that can stick around for some time. However, if consolidation or pullback don’t begin in the next few days, the index will run the risk of something more ominous. Overhead, the S&P 500 may be targeting channel resistance around 1520. Lower support levels of interest include 1480, then the 1460-1470 consolidation area, and finally the 50 day moving average and uptrend line around 1435 and rising.
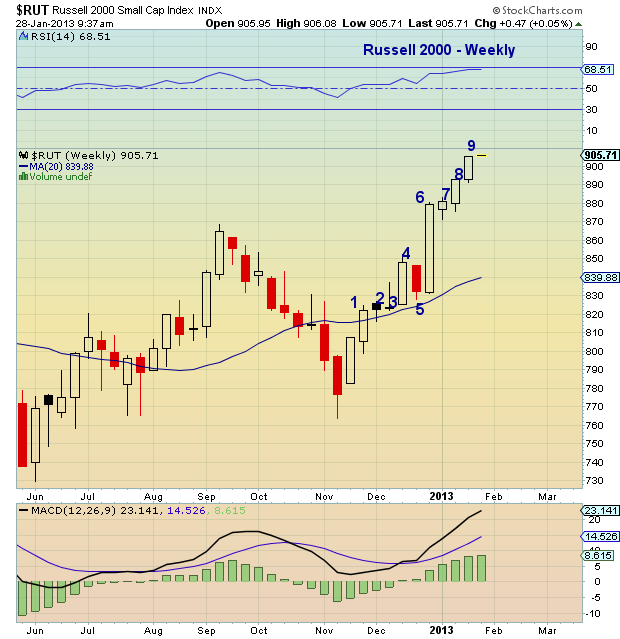
Another reason for caution is that DeMark weekly sell setup on the Russell 2000, which should produce a couple weeks of consolidation at a minimum (see chart below).
Trade safe, trade disciplined.
S&P 500 Daily Chart

Russell 2000 Weekly Chart
Twitter: @andrewnyquist and @seeitmarket
No position in any of the mentioned securities at the time of publication.


