In last week’s market outlook (“Stalemate“) I speculated about the potential danger of the market getting what it wanted from the Fed, namely no increase in interest rates. My view was that this could send a signal that the global economies were weaker than expected, hardly an outcome favoring the stock market bulls.
My prognostication abilities are generally as good as anyone else’s (in other words, they stink), but in this particular instance it looks like I was correct: the Fed announcement led to a brief euphoric rally that pushed the S&P 500 to around 2020, but the market then quickly reversed and all indices sold off hard into week’s end.
The selling pressure and volume was particularly pronounced in the major stock market indices because Friday was the dreaded “Quad Witching” day as well as the quarterly rebalancing for the S&P 500.
Price structure of the major indices is unequivocally bearish and almost all technical analysts seem to be in agreement that the path of least resistance is now down toward August lows.
I tend to get suspicious whenever there is consensus on anything market related, but in this case it is really difficult to argue for any sort of a contrarian/bullish case in equities (other than for a trade).
On the other hand, it seems like now could be a great time to join the bond bulls. Fixed income securities received a significant price boost from the Fed announcement. Longer dated US Treasuries in particular (see TLT below) seem ready for a push higher. Will the bond bulls get to enjoy one more moment in the sun?
The following is a review of select indices and sectors (with price action/analysis through last week).
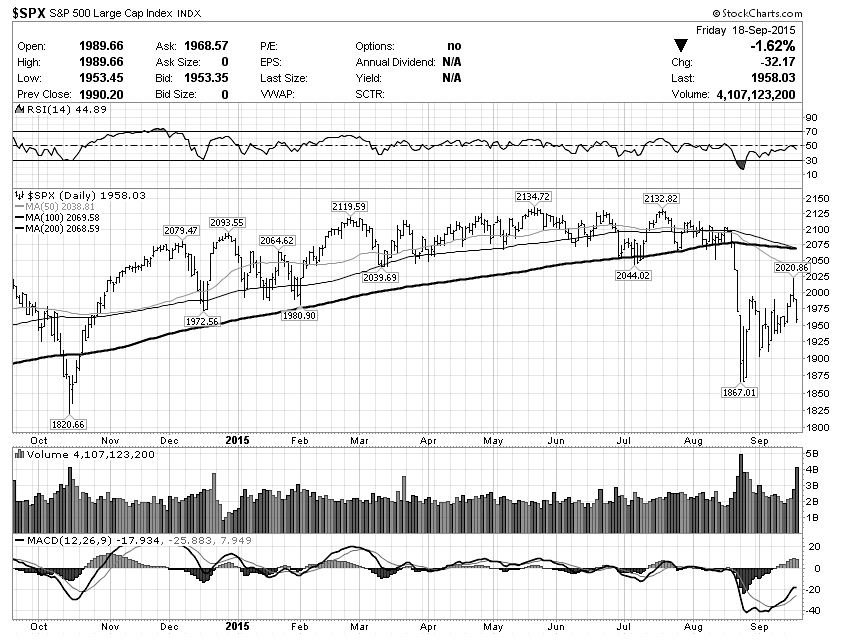
S&P 500 Large Cap Index (SPX)
Bearish Wedge? – Early in the week, the symmetrical triangle pattern morphed into an ascending triangle as the market rallied. Following the failed breakout and bearish reversal on Thursday and Friday, it became a bearish rising wedge and the close near the lows suggests more downside is ahead. Should the minor support at 1950 fail, the bears win and the S&P 500 will likely head for a retest of lows around 1870.
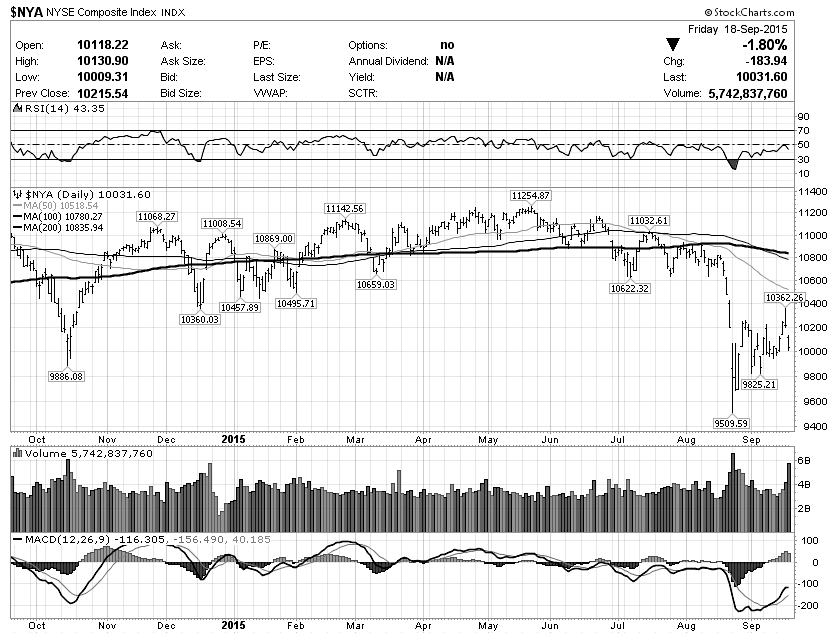
NYSE Composite Index (NYA)
Again, more of the same – Other major indices continue to essentially move in lockstep with the S&P and they all now have the “failed rising wedge pattern” price structure.
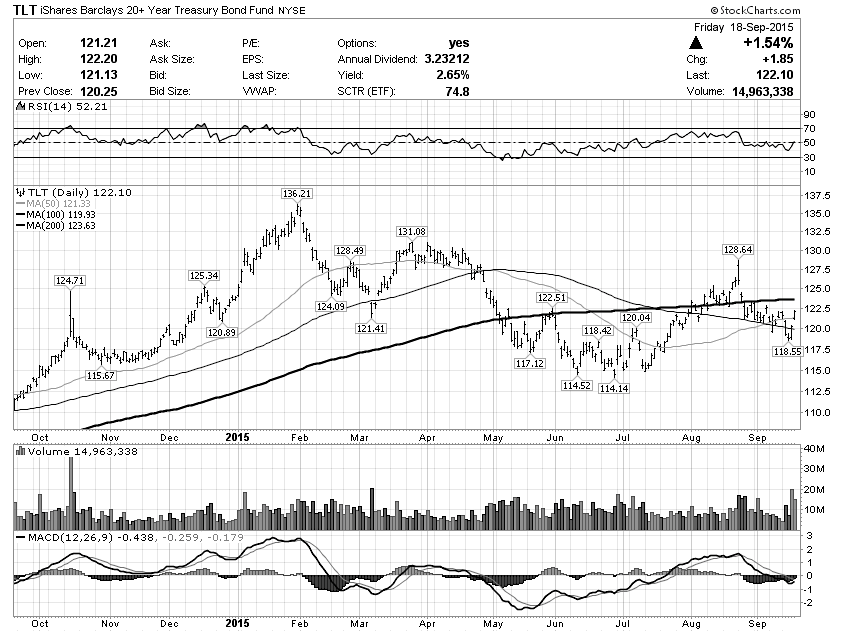
20+ Year Treasury Bonds ETF (TLT)
Bond bulls ready to run? – Long-end treasury bonds were the biggest beneficiaries of the Fed announcement and TLT had a strong bullish reversal on Thursday and Friday, essentially the mirror image of the price structures among equity indices. The path of least resistance for treasury bonds is now up with TLT ready for continuation toward 125. Will the bond bulls
continue reading for more on Biotech (IBB) and the Gold Miners (GDX)…


