 Last week’s price action did not change the overall technical picture. However, the S&P 500 (SPX) remains a laggard, closing the week basically where it began: under its 50 day moving average and beneath the 2100 level.
The Russell 2000 (RUT) continued to lead and is flagging within 1 percent of its all-time highs. A breakout to new highs would be bullish.
In that regard, the week was a disappointment for the bulls… especially those still waiting for that broader market breakout. Having gone for a while without it we need to be mindful of the fact that the longer the bulls are unable to pull it off, the higher the odds for a more substantive push lower.
Revisiting the “wedge-triangle” analysis from a few weeks back, it seems that the stock market remains in a somewhat precarious state.
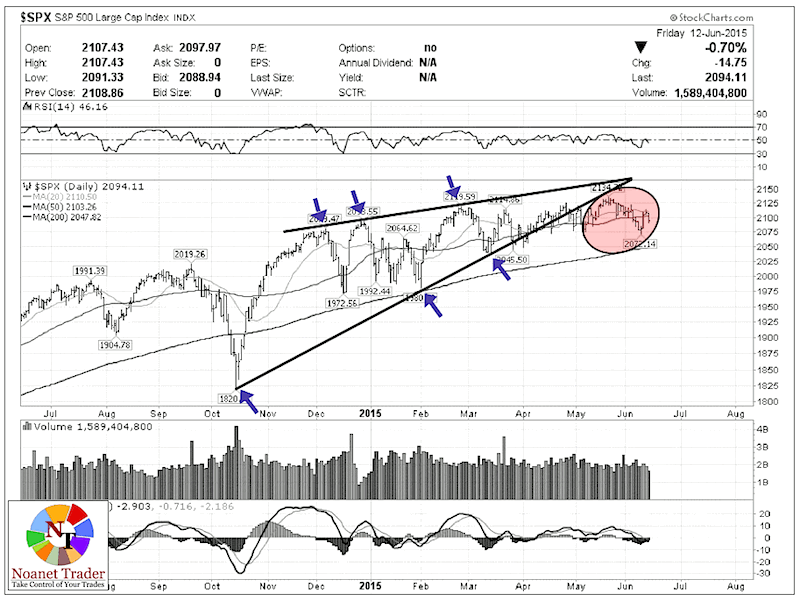
Looking at the S&P 500 from a “bearish wedge” view, the recent price action continues to look like a long bearish consolidation. If support at 2070 fails, it could lead to a measured move toward 2000.
S&P 500 Index – Rising Wedge?
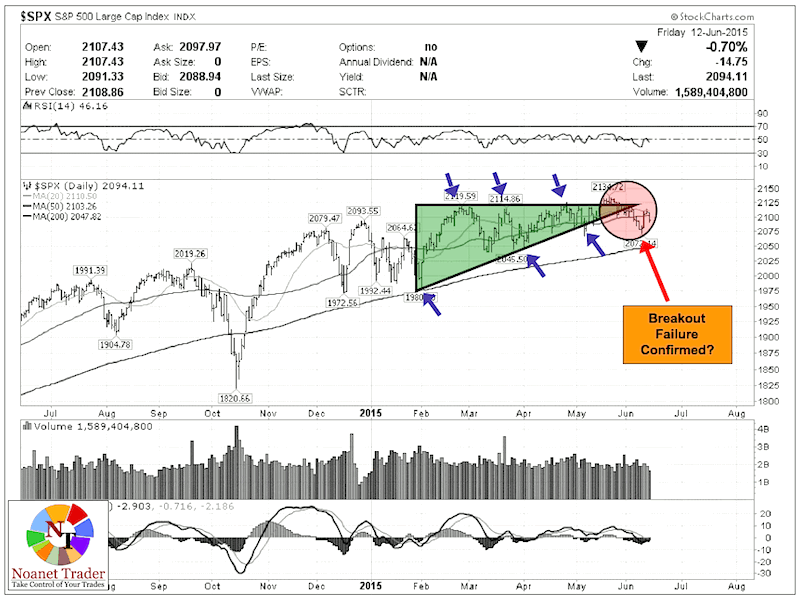
Even the “ascending triangle” view is starting to look a lot less bullish and last week’s price action (bounce off support followed by the rejection at the horizontal trend line) seems to confirm the overall breakout failure.
S&P 500 Index – Ascending Triangle Failure?
Some analysts have noted that the S&P 500 could be working on a bearish three-month “Head and Shoulders” pattern, but it is hard to give this much credibility because the pattern is far from complete and has a very poor reliability track record.
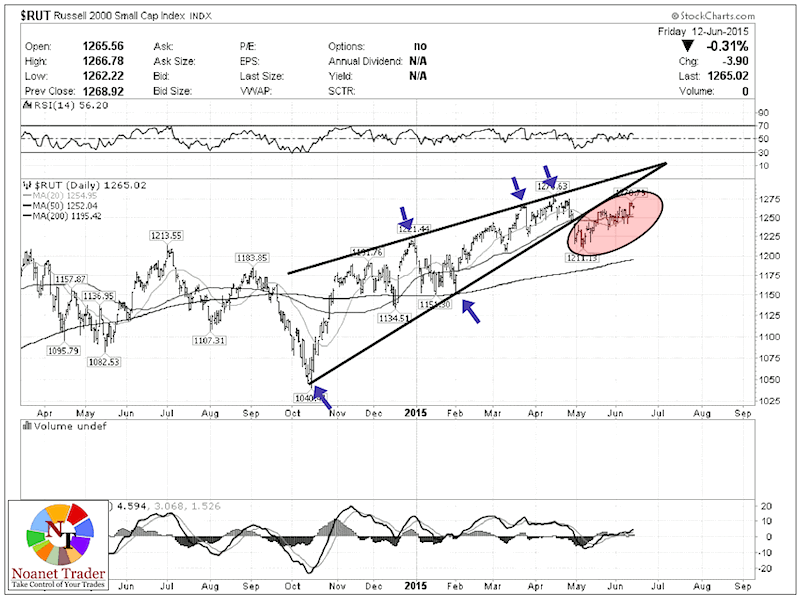
Taking a longer view at the Russell 2000 Index and applying a similar analysis, its short-term strength starts to look a bit suspect. Just like the S&P 500, the Russell 2000 also broke down from a seven-month rising wedge in May and has been consolidating under its lower trendline since.
Russell 2000 – Bearish Consolidation?
So, what does all of this mean for the coming week(s)?
In my opinion, it is up to the bulls to prove that they are indeed in charge.
Starting with the leader, all eyes will be on the Russell 2000 to see if it can break out and clear the 1280 level with conviction. The laggard S&P 500 needs to hold the 2070 support and then reclaim the 2120-2125 area.
Should the bulls fail this would open the door for a broader correction. Time to let the price action lead us.
Twitter: @NoanetTrader
Read more from Drasko on his blog NoanetTrader.
No position in any of the mentioned securities at the time of publication. Any opinions expressed herein are solely those of the author, and do not in any way represent the views or opinions of any other person or entity.


