By Jon Boorman We all know the old maxim of running winners and cutting losers. It’s been cited numerous times in many of the famous ‘market wizard’ interviews and plenty of other books and blog posts besides. What perhaps goes unsaid is that particular maxim applies more strongly to one group of traders than any other – trend followers.
By its very nature, trend following demands that a well-established move has already taken place before a trade can be entered, and to be proved wrong a reasonable retracement confirming the trend is over needs to unfold.
As a result, trend followers typically have more losing trades than winning ones, but, crucially, the winners will be far greater in magnitude than the losers.
The big winners can be rare, but they are hugely rewarding both in p&l, and the satisfaction of knowing the patience and discipline that was required to make them so. The losers are frequent, but if we’ve done our job they’re small.
When you’re already in the position of knowing you will have more losing trades than winning ones, you quickly learn to cut those losers as soon as possible. They’re a cost to your business, direct to your bottom line. The rare big winners can only compensate for the losers and make you profitable overall if the losers are kept in check.
Trend following when done right always looks easy. That’s because in essence the principles are very simple. When looking at a chart of winning trend following entries and exits it can look appealing, but what that chart won’t show you is the psychological and emotional toll such a strategy can take.
We know to expect and accept losers, but what if we get many of them in a row, what if we got 6 or 7 consecutive losers, would we still take that next trade as confidently as we did the first?
I have a simple trend following system of 10 futures that I trade, and document the positions for my blog. It’s been doing its usual thing with lots of small losers and a few big wins shorting Gold, Bonds, and the Yen.
The one market that has been more frustrating for us than any other this year is Crude Oil. Let me show you why. Here’s a chart of all our trades up to the end of June this year.
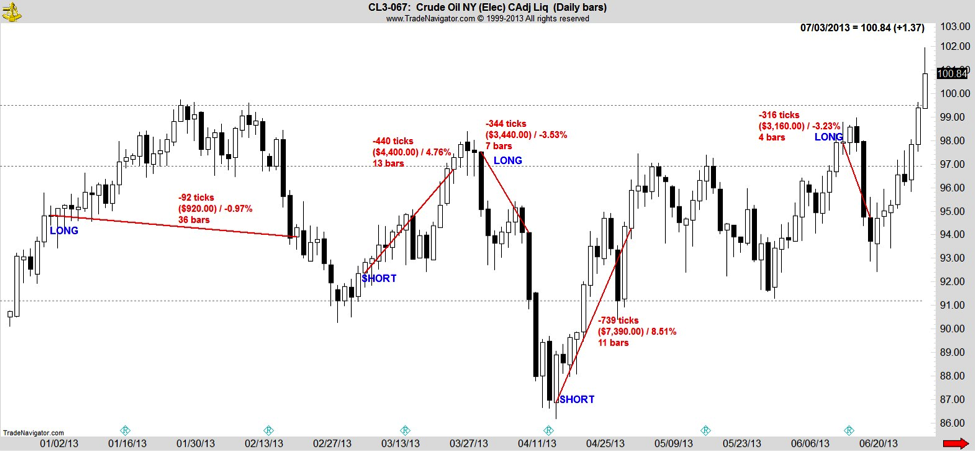
For consistency the prices are on a back-adjusted continuous contract basis so as to account for all the contract rolls from one contract month to the next. The figures aren’t actual p&l amounts, they are all ‘per contract’, ie how much you would have won or lost for each contract traded.
You get the idea. Been rough hasn’t it?
Normally I advise people when first looking at a chart to start at the top right and look back, here I need you to do the opposite. Assume you don’t know what transpired. Can you see why each and every signal was taken? How each time it looked like a new trend had been established?
Now imagine how you would feel after each successive loss:-
Trade 1 – A nice steady uptrend, you enter long, everything going well, we hit some congestion, a big down day but we’re still above your stop, maybe the market will confirm. It does. You’re out with a small loss.
Trade 2 – Feeling good about your previous exit as price continued to decline, it’s now established itself as a downtrend. You enter short only to see it move against you relentlessly, taking out your stop.
Trade 3 – Three days after being stopped again, after price consolidates just shy of new highs you get a long signal. It cruelly runs hard the other way and after a brief bounce attempt fails, triggers your stop.
Trade 4 – Feeling a little battered and bruised you again comfort yourself with the fact that you exited your previous signal when you did, because it went into freefall after that. In doing so it also triggered a new signal. You take it only to see another vicious reversal against you. Your risk/reward was less attractive on this one as the stop was further away so your position size is smaller, but it still hurts.
Time out. How do you feel right now? I forgot to mention you’ve also been posting your trades on social media and once you start you can’t stop, especially when you lose. They’re saying to you ‘whatever your next trade is I’ll take the other side’, and ‘the next time oil signals you should just go and buy yourself something nice.’ Get ready.
Trade 5 – The consolidation that has formed over the past few months is now obvious to every market observer on the planet. You’ve personally experienced every twist and turn that built it. Now every man and his dog is getting long for the breakout. While posting on the dangers and strong possibility of a ‘fakeout’ you get your own buy signal. Three days in, crude suffers a huge down day taking out all the weak hands and triggering your stop.
Two things to quickly note here: Notice how despite the run of losses, in some cases by exiting quickly we saved ourselves from something that could have become much worse and affected our ability to take the next signal. Second, note we took long and short trades without prejudice, we didn’t profess to know what would happen, or which side was right, only that one side was gaining momentum over the other. We join whoever appears to be winning the battle, we’re mercenaries, we fight with the winners and our only loyalty is to the most recent trend.
OK. It’s now July. Six months gone, 5 signals taken, all losers. Look to the last bar on the chart.
After an impressive thrust higher, Crude has now broken out, or has it? You’ve been here before. There’s political turmoil in Egypt, that’s what the pundits are saying the reason for the rally is. It’s the day before July 4th. You’re looking forward to a relaxing day with the family and watching Joey Chestnut stuff his face with 60 hot dogs. You don’t want to be worrying about this position. It’s a holiday. You’ve been burnt 5 times already. Will you resist the temptation to sit this one out? Do you take the signal?
Of course you do. You’re a trend follower.
You don’t have to rationalize price and trends, you just have to follow them.
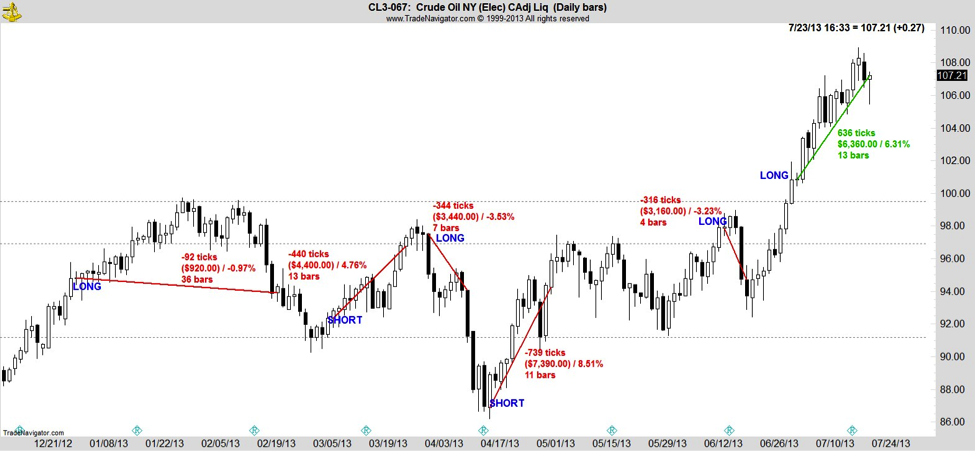 We have no idea if this is the winner that pays for all the other losers. What we do know is it’s just another trade. And, although we are not immune to the feelings a run of losers generates, we know that when you are trading a positive expectancy system you have to take every trade regardless. Enter the sixth trade like you did the first.
Let me leave you with one last chart related to trend following.
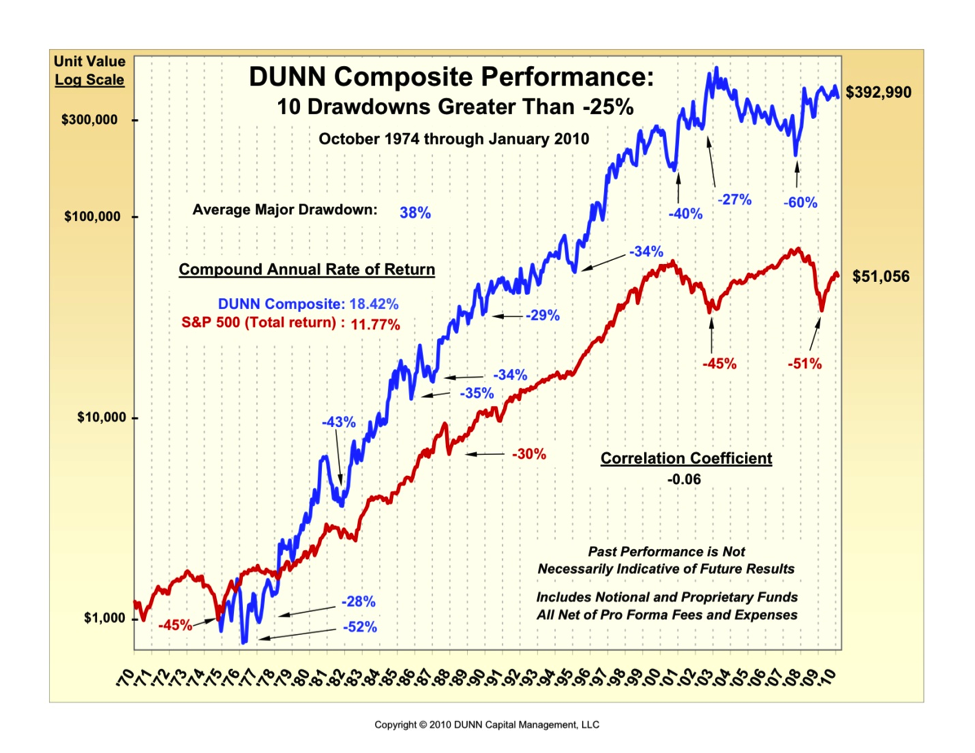
This is a chart of Bill Dunn’s performance as seen on Michael Covel’s site trendfollowing.com.
Bill Dunn has been running money for nearly 40 years. His compound annual rate of return is over 18%. Look at his drawdowns. His average major drawdown is 38%. Now ask yourself, how did he come out of them? How did he survive? I wasn’t there with him but I’m pretty sure I know the answer.
He took the next trade. And he took the one after that, and the one after that.
As a trend follower your job is not to eliminate losing trades, they are part of a winning system. Your job is to limit their size, not their number. It’s why so many great traders recommend never risking more than 1% of your capital on a single position. The losers can mount up and take their toll on your financial capital and mental capital.
As soon as we’re wrong we get out. If we allow a move to go beyond the point at which we’re wrong, we risk falling victim to the very trades that can keep us in business. Remember that bottom line. Run winners, cut losers.
It’s what trend following more than any other trading discipline is all about, and it’s why it works.
About this author: Jon Boorman, CMT is a market technician and trader with over 25 years experience in global equity, forex, and futures markets. He currently writes the Alpha Capture blog where he employs trend following and momentum strategies to generate actionable trade ideas. Jon will shortly begin managing money for clients as President and CEO of Broadsword Capital, LLC.
Twitter: @JBoorman
Charts by TradeNavigator.com
Author was long Crude Oil at the time of publication.
Any opinions expressed herein are solely those of the author, and do not in any way represent the views or opinions of any other person or entity.


: Showing Some Signs of Emerging Strength")
