Last week’s action is in line with our expectations. The three prior intermediate corrections from (and including) the June 2012 low through the May-June 2013 decline have ranged between 7.5% and 10.9%.
A similar performance this time implies a potential further weakness to the 1582-1524 range. In addition, we typically expect a correction to retrace at least 38.2% of a prior rally.
In this case, that suggests support at 1540, which is in the middle of the aforementioned 1582-1524 range. To get to this range, we’ll incorporate Elliott Wave analysis and take a look at the Coppick Curve.
In terms of time, the three previous corrections unfolded over the course of 6-10 weeks. The current pattern is entering its seventh week. Here’s a current market trend breakdown:
Primary Trend: Up
Intermediate Trend: Down
Minor Trend: Up
In terms of price, the current correction has yet to achieve what we consider to be minimum expectations. In terms of time, it is only now achieving minimum expectations. This combination allows for still lower lows in the weeks immediately ahead.
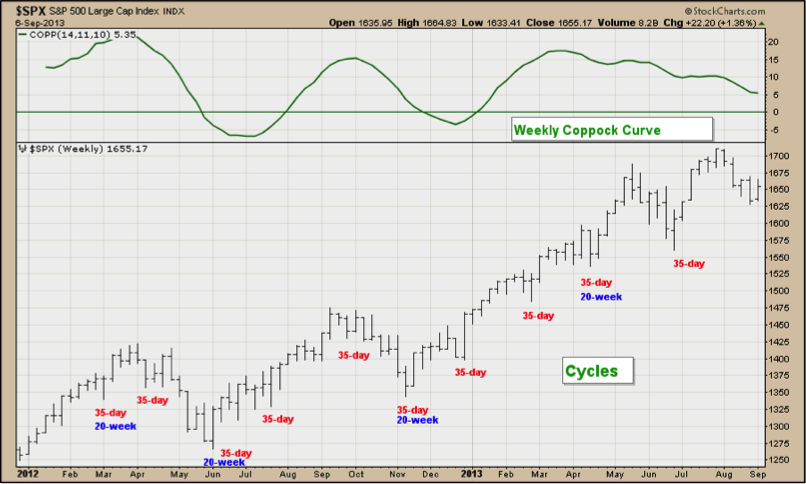
That said, both momentum and cycles also indicate additional weakness. As mentioned, the weekly Coppock Curve is in a downtrend for both the S&P and DJIA. This bearish bias is positioned to continue into at least mid-October and possibly into early November. At the same time, the current 35-day cycle, which began on August 28 is not yet two weeks old and is not ideally due to bottom until mid-October. This 35-day low will likely also mark a 20-week cycle low.
As for sentiment, our proprietary sentiment index has only recently crossed to the oversold side of neutral, but is not yet truly oversold. However, sentiment is a trend-following indicator and tends to have divergences at important tops and bottoms (especially tops); our index has already recorded bearish divergences. Separately, the short term 10-day CBOE put/call ratio is still near overbought levels.
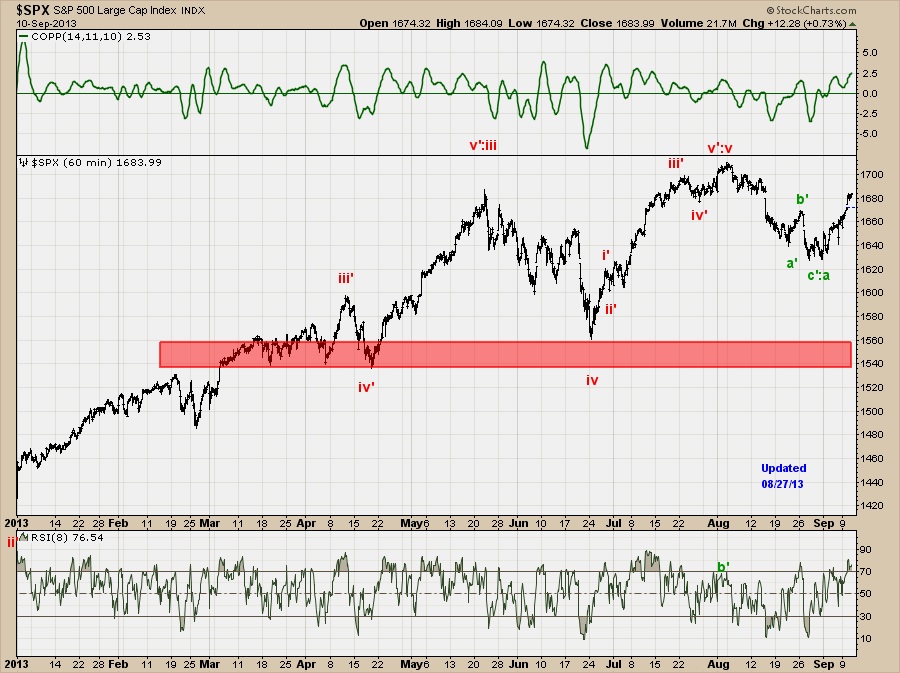
All of this brings us to our Elliott Wave counts. We expect the current decline to be an ABC pattern. The rallies for both the S&P and DJIA since the August 28 low are already the largest since the early August highs. This suggests that both indexes are in a lower degree a-wave. For the S&P, nearby resistance exists at 1665-1678. We expect the coming c-wave to be at least equal to – and possibly 1.618 times – the 82-point a-wave. Thus, if resistance holds, the c-wave will have the potential for a decline to at least 1596-1583 and possibly to 1545-1532 Thus, it would seem that potential post-August wave relationships are in reasonable harmony with the 1582-1524 support range mentioned above.
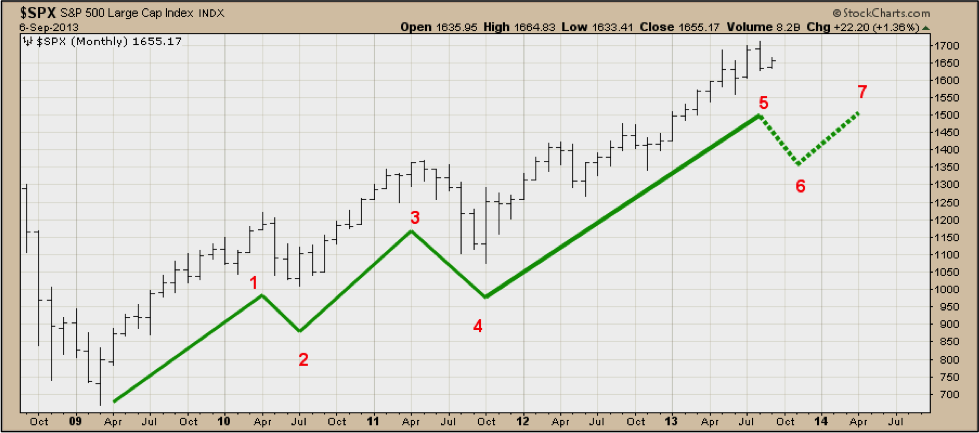
From a longer term perspective, we continue to expect at least seven waves to unfold before the post-2009 uptrend is complete. Nominally, this uptrend already has five waves, but the third wave rally (July 2010 to April 2011) is shorter than both the prior first wave (March 2009 to April 2010) and the subsequent fifth wave (October 2011 to present). Since short third waves are forbidden in Elliott Wave, we expect the post-2009 uptrend to extend via a sixth wave correction and a final seventh wave to new highs.
With that scenario in mind, the current correction from the August high is a candidate – but only a candidate – to be the sixth wave correction. In order to confirm that this is the sixth wave, we will need to see a breach of April’s 1536 low. If the current correction falls well short (e.g.,1596-1583) of that benchmark, it will be viewed as a only pullback within a still developing the 2011-2013 nominal fifth wave with a more important sixth wave correction still to come.
Thanks for reading. Stay tuned.
Follow Walter on Twitter: @waltergmurphy
Read more from Walter Murphy on his website: www.wminsights.com.
No position in any of the securities mentioned at the time of publication. Any opinions expressed herein are solely those of the author, and do not in any way represent the views or opinions of any other person or entity. Charts from stockcharts.com.


