By Urban Carmel
The Fat Pitch blog is about inter-day swing trading. So, with not a little irony, this post will be about day trading.
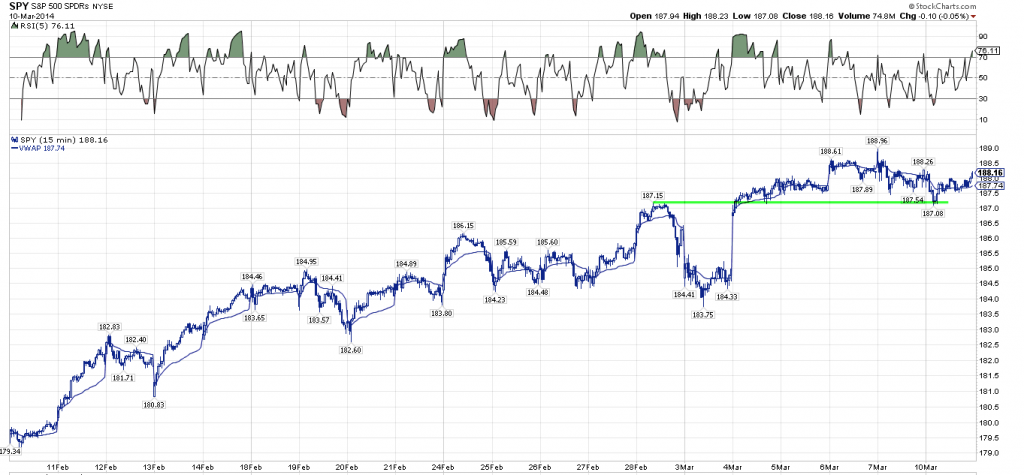
Experienced swing traders are familiar with support and resistance lines drawn from prior lows and highs on a chart. Price is attracted to these levels; when it closes higher than a prior resistance level, that level becomes support and price normally looks to the next higher resistance level as a target.
As an example, Monday March 10th’s low was on support level from the top on February 28. That level was previously resistance. If that level is broken in subsequent trading, it becomes resistance once again.
There is a simple way to use this same principle in day trading. Simple is essential, because timeframes are short and decisions have to be made quickly. There are a lot of ways to day trade; this post is about just one of those.
We can do everything with just three tools: pivot points, tick and vwap. We will briefly explain each of these below.
Pivot Points
Day trading originated with floor traders. Before electronic exchanges, floor traders looked at the prior day’s high, low and close to determine important levels for the current day. From this came ‘pivots points.’
Pivot points break down as follows. In the middle is a ‘daily pivot’; this is the average of the high, low and close of the previous day. On either side of the daily pivot are support and resistance levels; resistance is above and support is below.
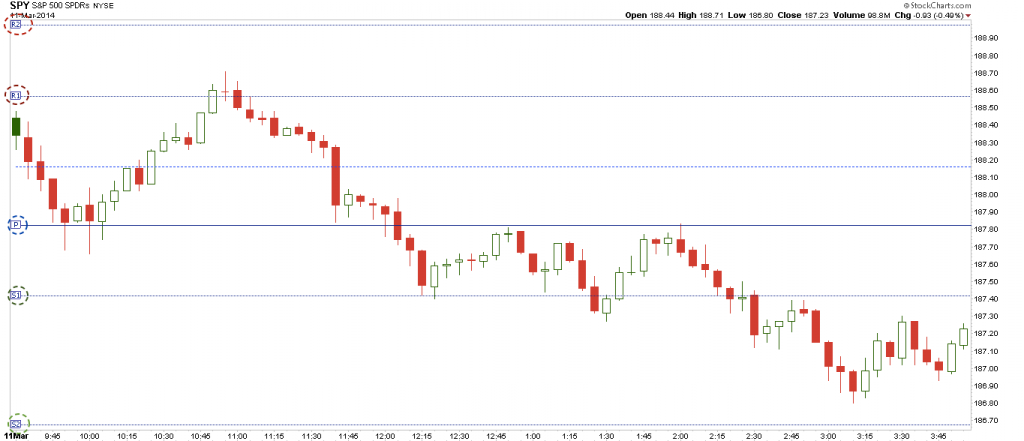
Above the pivot, the first resistance level is marked R1 and the next one is marked R2. The same is true for support levels below the pivot: S1 and S2. Below are the daily pivots for March 11 (circles).
To understand the logic of the market it’s helpful to know how these are calculated. Let’s start with R1 and S1. R1 is the distance from yesterday’s low to the pivot (green box). The basic idea is that price activity is symmetrical, so if price traded $1 below the pivot yesterday it might try to test that range to the upside the next day. The same is true for S1 (blue box).
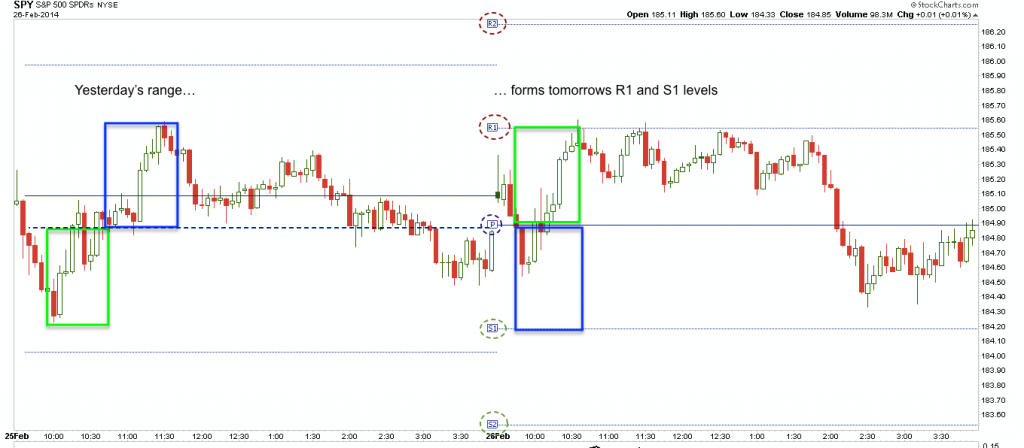
And, in fact, that’s exactly what happened in the two days shown above. The range to the downside in Day 1 (first green box) was tested to the upside four times in Day 2. That resistance level held. When SPY failed to go above R1, it flipped around to test lower support. And it closed right below the daily pivot.
Note also that the distance between R1 and S1 is equal to yesterday’s price range. In other words, if price stays between R1 and S1, the market is ‘rangebound’; it’s either lacking or waiting for a catalyst to move higher or lower. When traders talk about a boring day in the markets, it’s often a day that trades between S1 and R1. A day like Day 2 in the chart above.
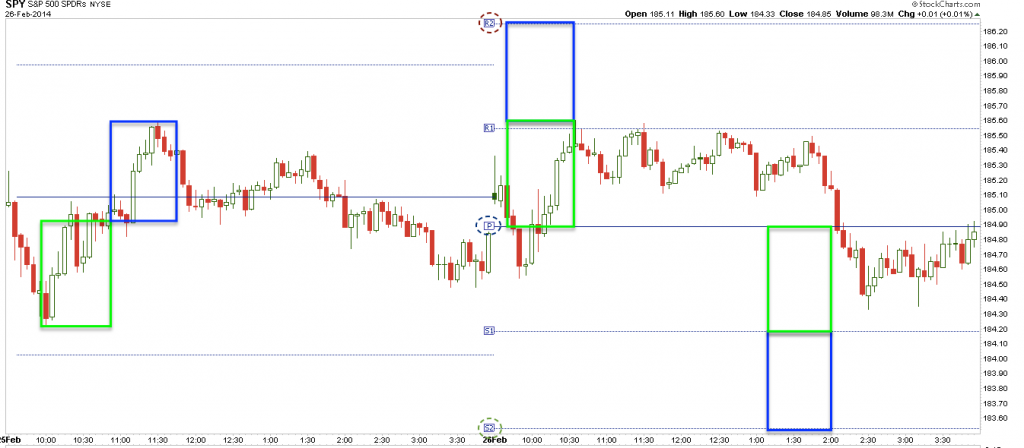
Next, let’s say price moves above R1 to R2. R2 is yesterday’s price range (high minus low, i.e. both the green and the blue box) added to the pivot. To get past R2, in other words, more than all of yesterday’s range has to be traded in one direction. Most often, R2 and S2 mark the high and low for the day.
You can make an easy day trading set up using www.freestockcharts.com and enabling pivot points on a 5-minute chart. We like to have the pivot points before the open so we can plan for potential day trades; you can find them here.
Tick
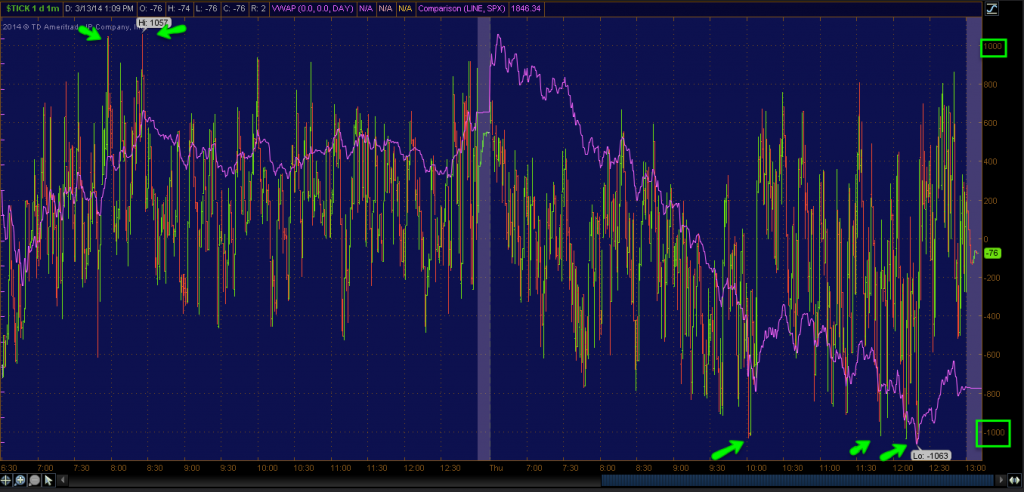
Tick measures the net number of stocks trading on ‘upticks’ versus ‘downticks’ on the NYSE. Upticks occur when buyers are motivated and accepting offers; downticks occur when sellers are motivated and accepting bids. When the net number of upticks exceed +1000, you have generally hit an extreme; -1000 represents an extreme number of net downticks. A blowout would be +/-1300.
Brett Steenbarger is an authority on tick. Here are two of his posts on the topic (here and here).
There is a lot of nuance in tick that this post will not address. Be aware that a cluster of low ticks or persistence of a greater numbers of low ticks than high ticks over the course days indicates big selling. In an uptrend, this can be a leading sign that the trend is changing.
The reverse is true of high ticks. After a major low, you often see a cluster of high ticks. This is big buyers getting aggressively long. A good sign.
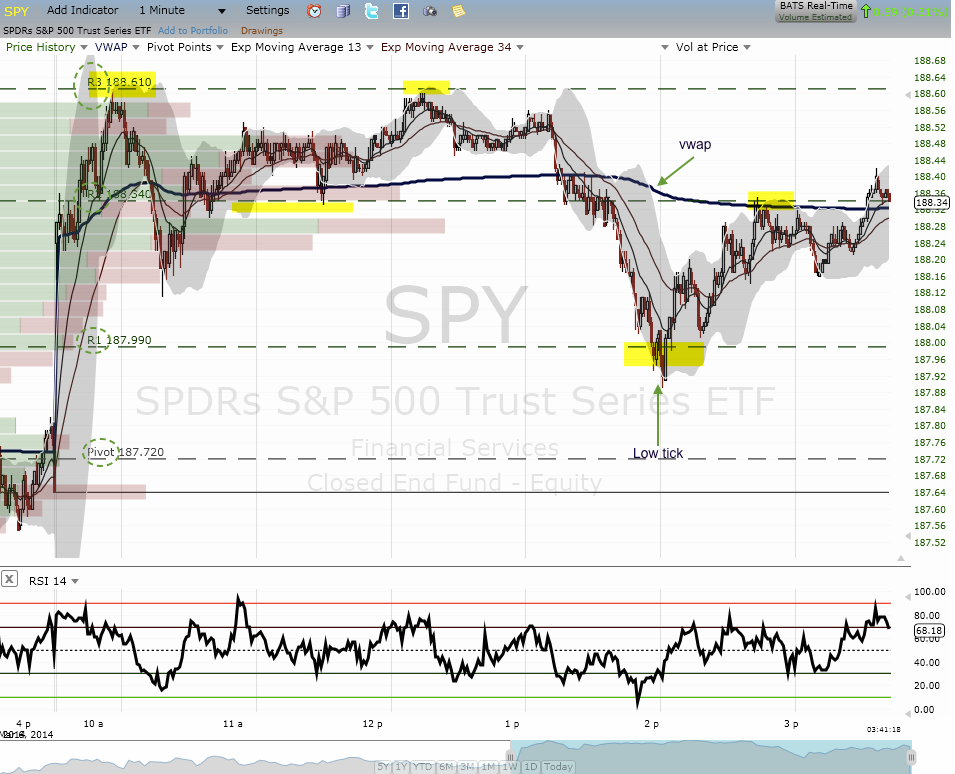
For the purposes of most day trades, a low tick is seller exhaustion. Below is an example. Note that it occurred right at a support level and it was a great day trading signal to get long.
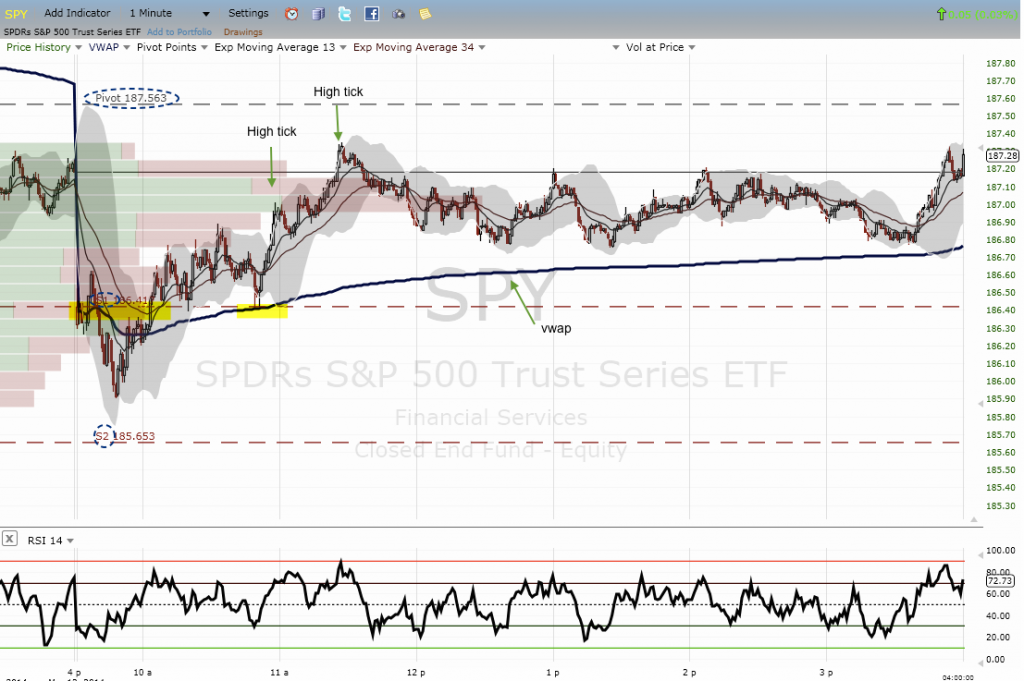
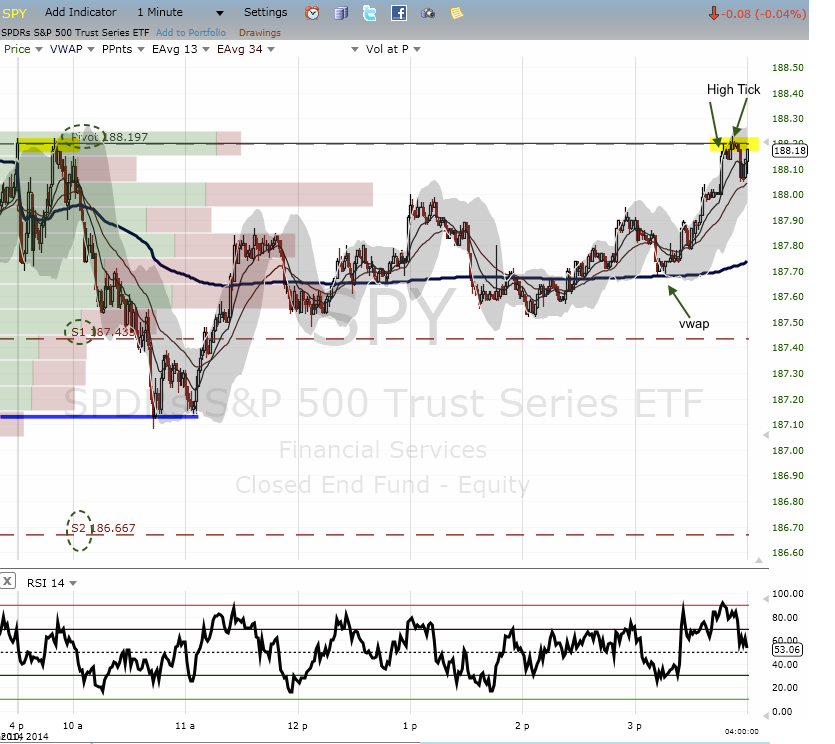
High ticks in a bull market are more common. Price may pause and then continue higher. It is harder to fade a high tick when the trend is higher, as the next example shows. The first high tick slowed the advance; the second high tick was better because it occurred at the prior day’s closing level (visible to the left). The concept is still that high ticks represent at least short-term exhaustion on the part of buyers.

Most trading software includes a tick feed. We have it set up in ThinkorSwim with alerts set at +/-1000 and an overlay of SPY (pink line). The high and low ticks are shown here with arrows.
Vwap
Vwap is simply volume-weighted average price. Because the price is weighted by volume, it tells you the average transaction price for a period of time, in our case a day. Because its volume weighted, it is more sensitive in the early part of the day.
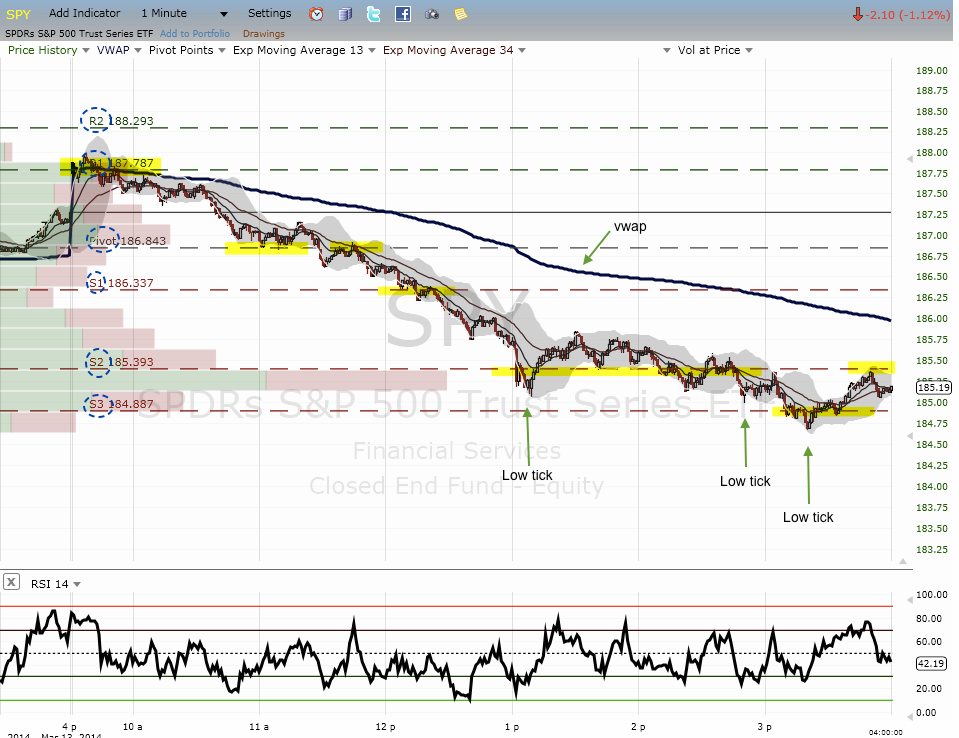
There are two uses for vwap. The first is in confirming trend. When price in unable to regain vwap and vwap is in decline, the trend is usually down for the rest of the day. Expect weaker bounces and lower support levels, which offers opportunity for day trading on the short side. Note how weak the response in the next example is from each low tick.
The reverse is true when price is above a rising vwap: an uptrend day.
A day with weak trend will see price criss-cross vwap. Below, the day ended flat after trading between only the pivot and S1 all day.
The second use for vwap is that it can act as intermediate support and resistance. Price can find resistance at vwap on rallies later in the day, as well as support at vwap on weakness. That is because large traders try to place transactions close to vwap; as a result, vwap can represent a liquidity point during the course of the trading day.
Put It All Together
Let’s first look at the course of a normal day using just pivot points.
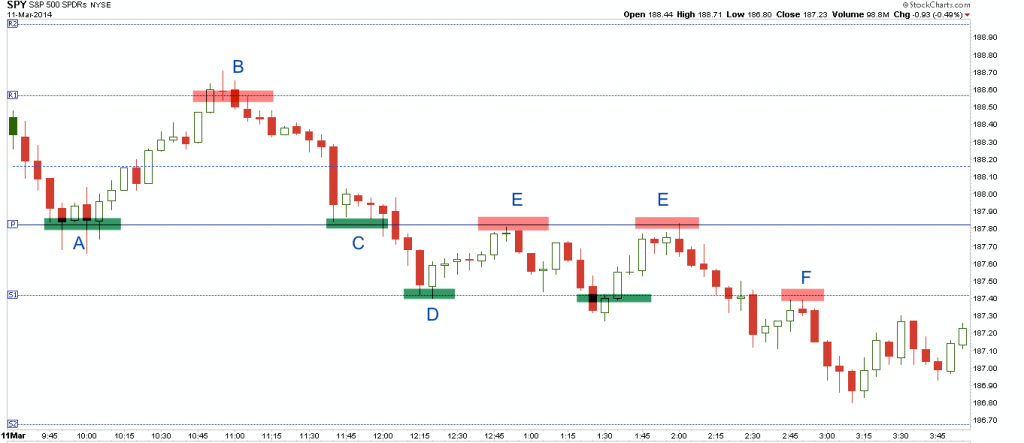
The pivot point lines are generated by the trading program; they are on the screen when trading begins. This day started by selling off right to the ‘daily pivot’ (marked A). Price consolidated and then bounced back to the first resistance level (R1; B), which held.
Returning quickly to the daily pivot was not a good sign, so the second test (C) failed, and price dropped to the first support level (S1; D) which held. Broken support becomes resistance so the two bounces back to the pivot (E) were met with resistance.
Falling back to support was also not a good sign; when it failed (F), price dropped to a new low.
Not every day is as clean as this one so let’s look at another example, this time including tick and vwap.
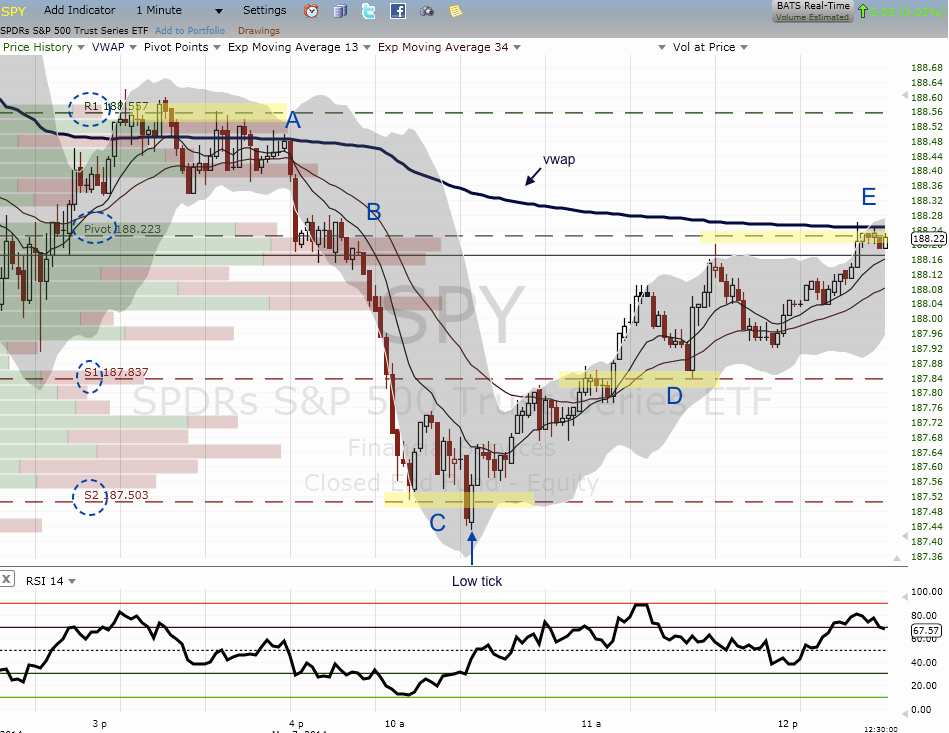
There’s a lot of nuance in this chart so we will keep it simple.
Price opened at yesterday’s close (A) and quickly sold off to the daily pivot (B) where it consolidated for 10 minutes. Long red candles, no bounce and breaking the pivot are all signs of weakness, so the fall to the next support level was not a surprise. What was surprising is that it did not stop there (S1), but continued all the way to the lower support (S2; C).
Here, there was a typical ‘oversold’ reaction upwards and then a fall back to support, at which point there was a -1000 ‘tick’ (marked) which often shows short-term capitulation. This was the easy trade of the day. From there, price moved back up to the first support level (S1; D) and then rose further into the close at the daily pivot and vwap.
Even though S1 was not support on the way down it became resistance and then support on the way back up. Without the pivot points, a day trader would have likely missed this reference level.
Basic Trading Rules
There are some basis trading rules that we use, most just like those used in swing trading. These are the key ones to remember for day trading:
- Risk/reward: The most important is calculating risk and reward. Your stop (below support for a long) should be less than half the distance to the target (resistance). This makes your risk/reward 1:2 or better.
- Market direction: The next most important rule is to primarily trade in the direction of the market. In a bull market, you will have an easier time buying support than shorting resistance.
- Reduce risk: Take a partial profit at each level (S1, R1, etc). In the first example above, price moved back and forth so many times there would have been little profit otherwise.
- Trend day: Trading above the pivot is bullish. Trading above rising vwap is even more so. Below the pivot and below a declining vwap are bearish. These are your guidelines for determining trend during the day. Trade with the trend.
- Range: A wide ranging day is normally defined by the second resistance level (R2) and the second support level (S2). The odds are in your favor that price will reverse at those areas (as in the last example above). In a bull market, opening at S2 is often a high probability long.
- Improving odds: Tick further improves your odds. For this post, we will generalize and say that low tick (-1000) is sign of exhaustion; when it comes at support (like the second example above), you have a better long trade. A high tick (+1000) at resistance is usually followed by weakness due to buyer exhaustion. However, be aware that in a bull market, you should expect more high ticks, and for weakness to be fleeting.
About This Author: Urban Carmel is the author of the blog The Fat Pitch. From his blog: “The stock market serves a lot of curve balls. Now and then comes a Fat Pitch, your odds-on opportunity to swing the bat. Get on base and then manage your base-runners.” Be sure to follow Urban Carmel on Twitter: @ukarlewitz
Any opinions expressed herein are solely those of the author, and do not in any way represent the views or opinions of any other person or entity.


