Technology stocks have lead the market higher for nearly 2 decades. Semiconductors have been a big part of that leadership.
And the leader of all leaders, Nvidia (NVDA), has helped the Nasdaq soar over the past year.
But its leadership has come into question of late… is Nvidia’s stock price stalling out at a key price level?
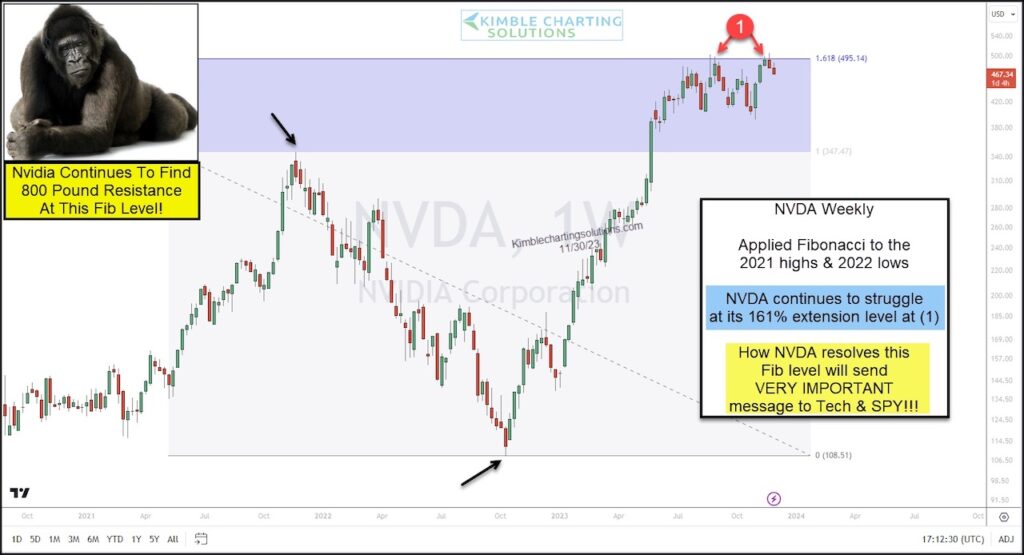
Today we look at a “weekly” chart of NVDA and highlight a critically important resistance level.
As you can see, Nvidia’s rally stalled out at the 1.61 Fibonacci extension level at (1) and continues to struggle with this Fibonacci level, bumping up against it a few times over the past four months.
Will this pattern result in a major price top or will Nvidia (NVDA) be able to breakout above this key Fib level? How NVDA resolves this resistance will send a critical message to the technology sector and broad market. Stay tuned!
$NVDA Nvidia “weekly” Stock Chart
Note that KimbleCharting is offering a 2 week Free trial to See It Market readers. Just send me an email to services@kimblechartingsolutions.com for details to get set up.
Twitter: @KimbleCharting
Any opinions expressed herein are solely those of the author, and do not in any way represent the views or opinions of any other person or entity.


