The current weight of evidence continues to suggest a neutral/bearish toward equities as a whole, with short opportunities available in select areas. One of the reasons for this stance is the potential squeeze that’s setting up in the Volatility Index.
There are three charts that suggest Volatility could be headed higher over the short-term, which would obviously be a negative for the equity market.
The first chart is a daily chart of VXX, the iPath S&P 500 VIX ST Futures ETN.
Prices of this ETN recently confirmed a failed breakdown below the August lows as momentum diverged positively. In addition to that, the presence of a flat 200 day moving average suggests a trading range is likely to continue in this market until prices consolidate in one direction or another. Flat smoothing mechanisms normally cause headaches, but in this case we can use the choppiness that results from them to our advantage.
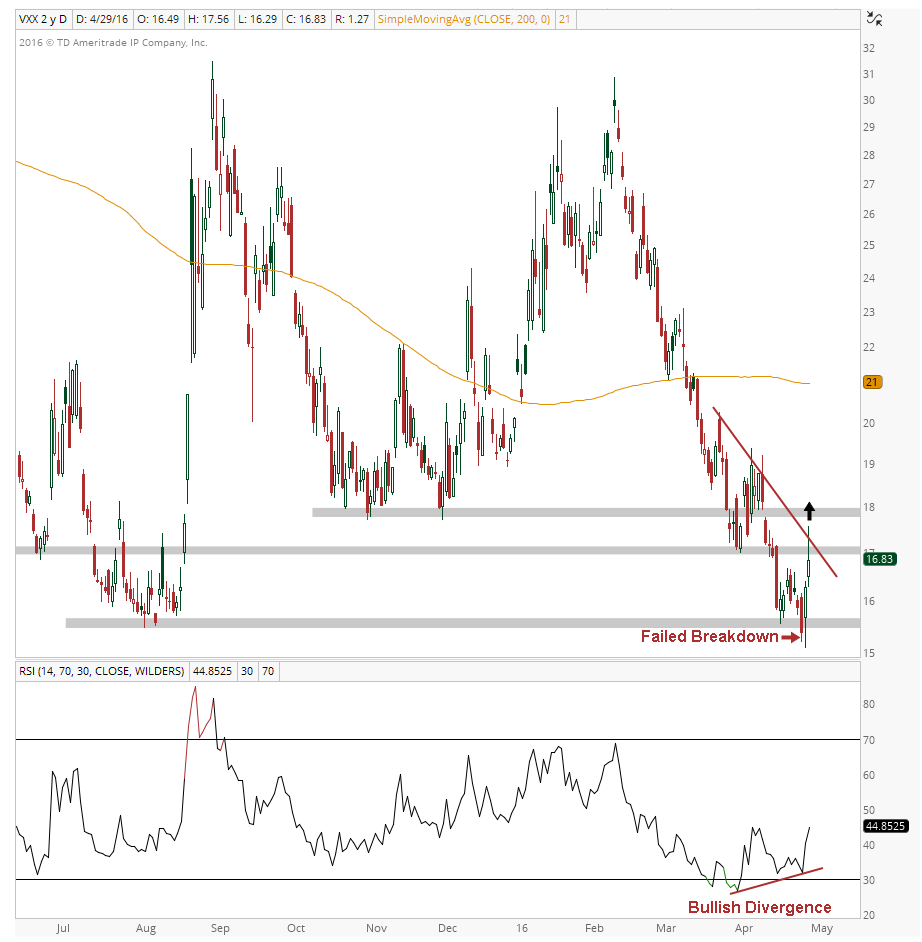
As long as prices remain above the August lows on a daily closing basis, the bias remains to the upside with a target at 21. A positive development would be continued upside follow through above the downtrend line from the March 24th highs and prior support / resistance levels near 17 and 18.
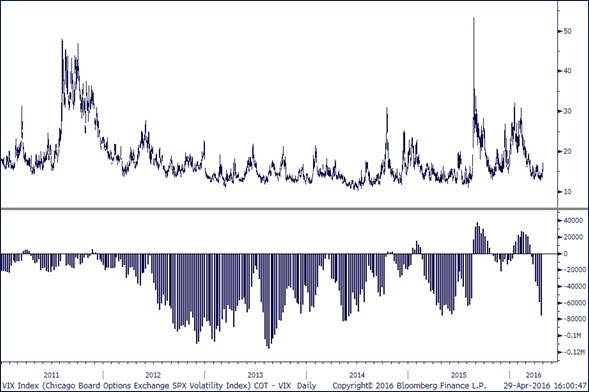
The second chart represents the price of the VIX Volatility Index on the top pane, with the net positioning of large speculators below it on the second pane. What’s important here is to note that large speculators are currently adding to a net-short position that’s already near a 1-year high.
The third chart shows S&P 500 Futures on the top pane, with the net positioning of commercial hedgers (blue), large speculators (green), and small speculators (red). What’s important to note here is that large speculators have gone from net short S&P 500 Futures to net long for the first time since early 2015.
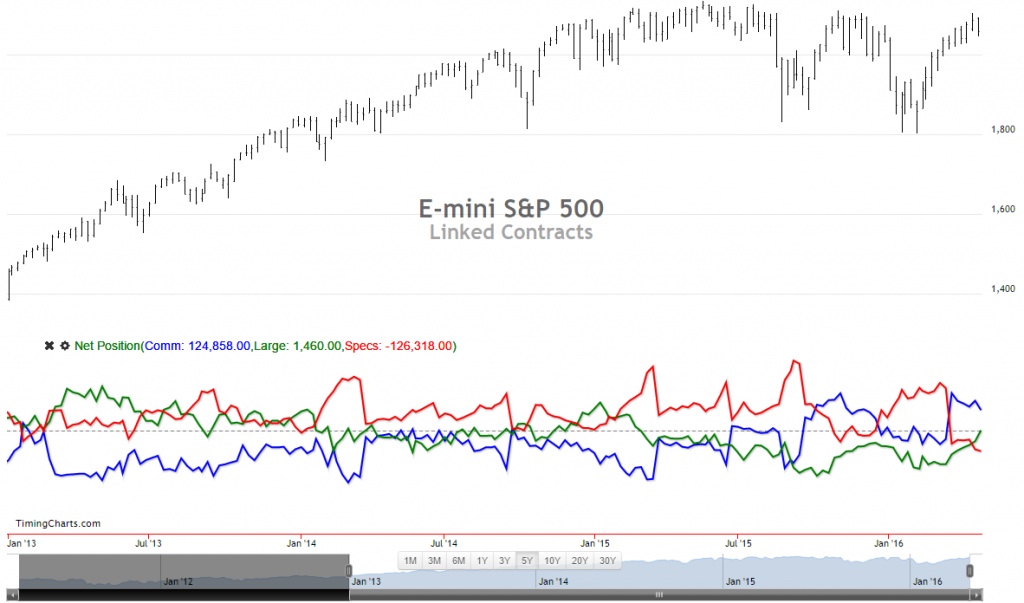
The fact that large speculators are throwing in the towel on their S&P shorts and are adding to their Volatility short suggests there’s massive squeeze potential in this market if Volatility begins moving higher.
The Bottom Line: Based on the price action of VXX and VIX, along with the potential sentiment unwind that could occur in this market, risk/reward in Volatility is currently skewed in favor of the bulls. As long as VXX continues to hold above the August lows on a daily closing basis, the bias remains higher toward 21. Whether you trade this particular setup or not, it is important to be aware of what’s happening in this market because of it’s implications for US equities as a whole.
If the broader market continues to correct through time, rather than price, that would be extremely constructive for equities as a whole and we’ll likely have to reassess this volatility thesis.
Thanks for reading and, as always, if you have any questions feel free to reach out or comment here and I’ll get back to you as soon as I can.
Twitter: @BruniCharting
The author does not have a position in any of mentioned securities at the time of publication. Any opinions expressed herein are solely those of the author, and do not in any way represent the views or opinions of any other person or entity.

: Showing Some Signs of Emerging Strength")
