Stocks pushed a bit higher last week. But this week may bring a change in character for the stock market.
My market cycle indicator and accompanying forecast are pointing to a down week for the stock market. Be on alert for a short-term top this week.
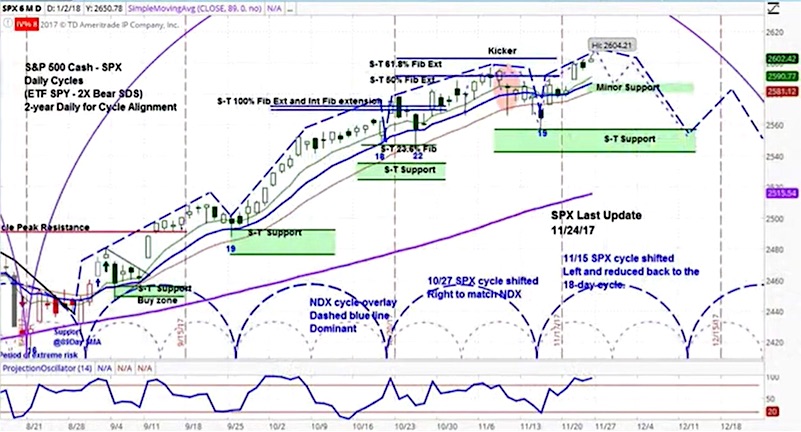
Stock Market Summary Review & Cycle Forecast:
The S&P 500 Index (INDEXSP:.INX) moved higher last week, rising by 0.9%.
Uncertainty in Europe ticked up, as Angela Merkel’s attempt to form a coalition government in Germany hit an impasse.
Chinese stocks dropped by 3% on Thursday as the market became increasingly concerned with the country’s debt and inflated asset values.
The stock market moved higher last week, with the S&P 500 (SPX) moving up 24 points to 2602.
On Monday, German Chancellor Angela Merkel’s attempt to form a coalition government broke down, as the pro-business Free Democratic Party pulled out of coalition talks, which was followed by a brief pullback in equity futures. This increases political uncertainty in Europe, as Germany has been a source of stability for the last decade.
On Tuesday, Goldman Sachs announced that it was bullish on stocks in Europe and the US, which pushed markets higher. On Wednesday, the Federal Open Markets Committee released its most recent meeting minutes, which indicated a concern with inflation as well as a potential stock market reversal that could hurt the overall economy.
On Thursday, Chinese stocks dropped 3% and sovereign bond yields rose above 4%, as the market grew increasingly concerned with complacency towards debt. On Friday, the purchasing manager’s index decreased to 53.8 from 54.6 for manufacturing and to 54.3 from 54.6 for services. The US markets were relatively quite towards the end of the week due to the Thanksgiving holiday.
Forecast
The SPX chart above shows our projection for the coming week: a move lower and then higher again as the short-term market cycle ends and a new one begins. As we noted in last week’s article, if the stair step pattern that has been in place from the start of this intermediate cycle is broken, keep your eyes peeled for a move lower.
The blue-dotted half circles at the bottom of the chart illustrate the short-term cycle patterns. For a more detailed look at cycle analysis for a broader selection of future contracts, watch the askSlim Market Week every Friday afternoon.
Here’s the latest askSlim Market Week Video:
Twitter: @askslim
Any opinions expressed herein are solely those of the author, and do not in any way represent the views or opinions of any other person or entity.
 Rolling Over At Key Fibonacci Level?")


 Rolling Over At Key Fibonacci Level?")


