 Greece couldn’t do it. Poor company earnings along with lower forward guidance couldn’t do it. Not even strong hints of a September rate hike by the Federal Reserve!
A technical market correction in the stock market is typically referred to as a drop of 10 percent from the highs.
It took a slow down in the world’s number two economy, China, to force this stubbornly bull market into a market correction.
Let’s take a look at the 4 major indexes to see where we are after Friday’s gouge of the Dow Jones Industrial Average (DJIA) where it gave up -530 points.
Three indexes have hit their 10% market correction level with the Standard and Poor’s 500 being shy of the mark. But all four will likely be in correction land when the markets open Monday – the futures market looks very heavy.
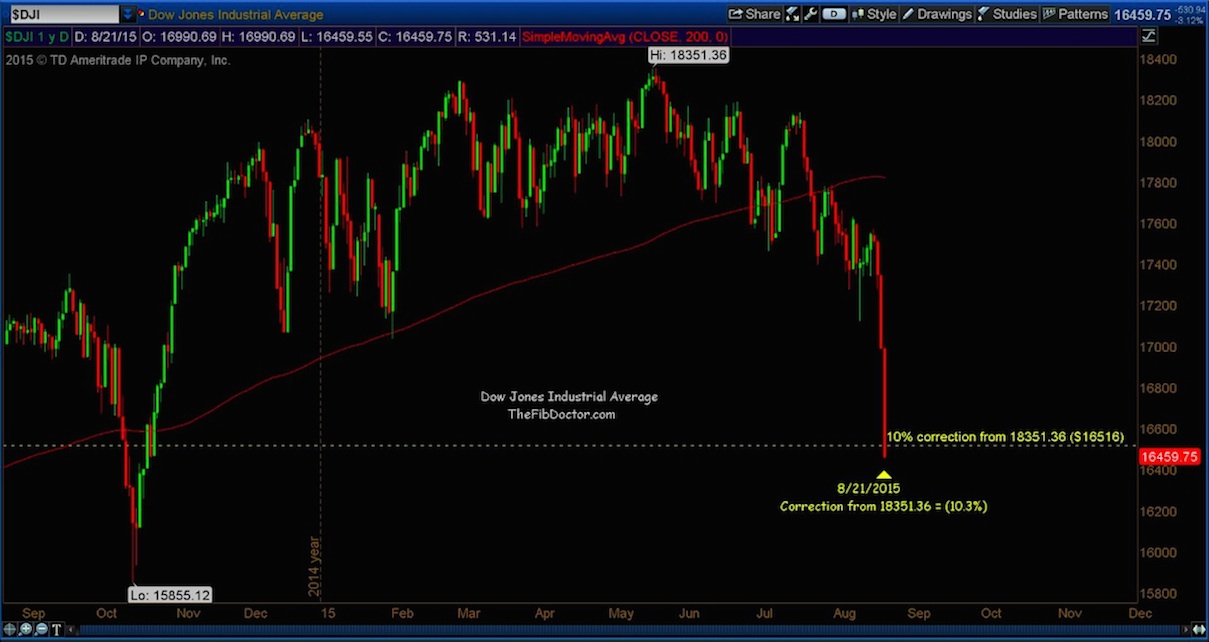
- Dow Jones Industrial Average = (10.3%)
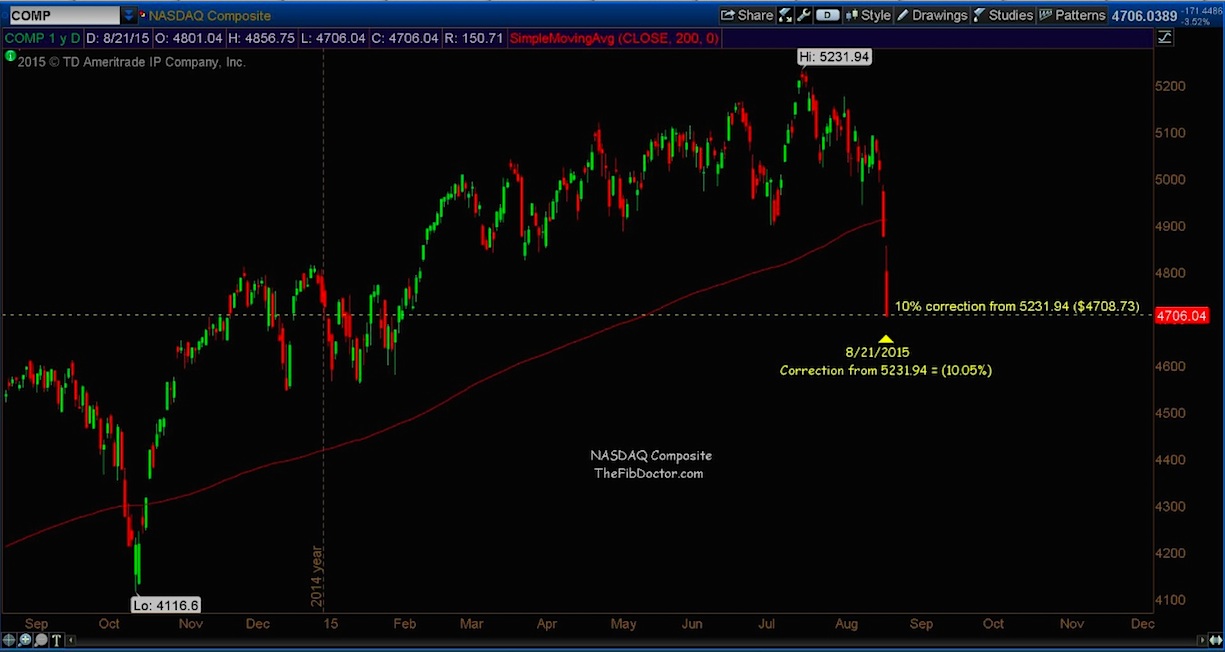
- NASDAQ Composite = (10.05%)
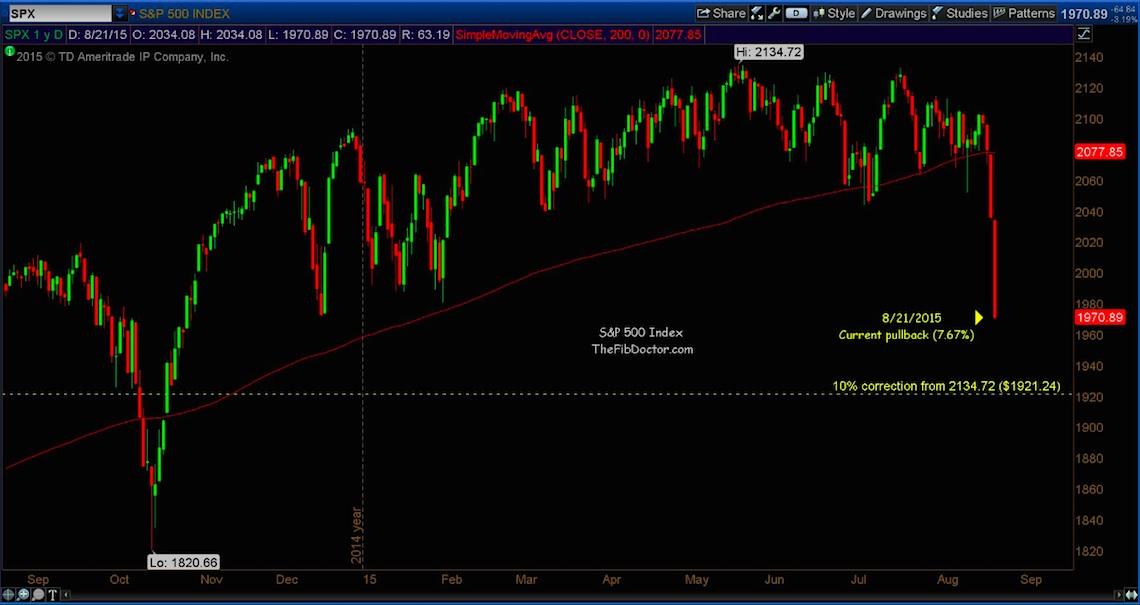
- Standard and Poor’s 500 Index = (7.67%)
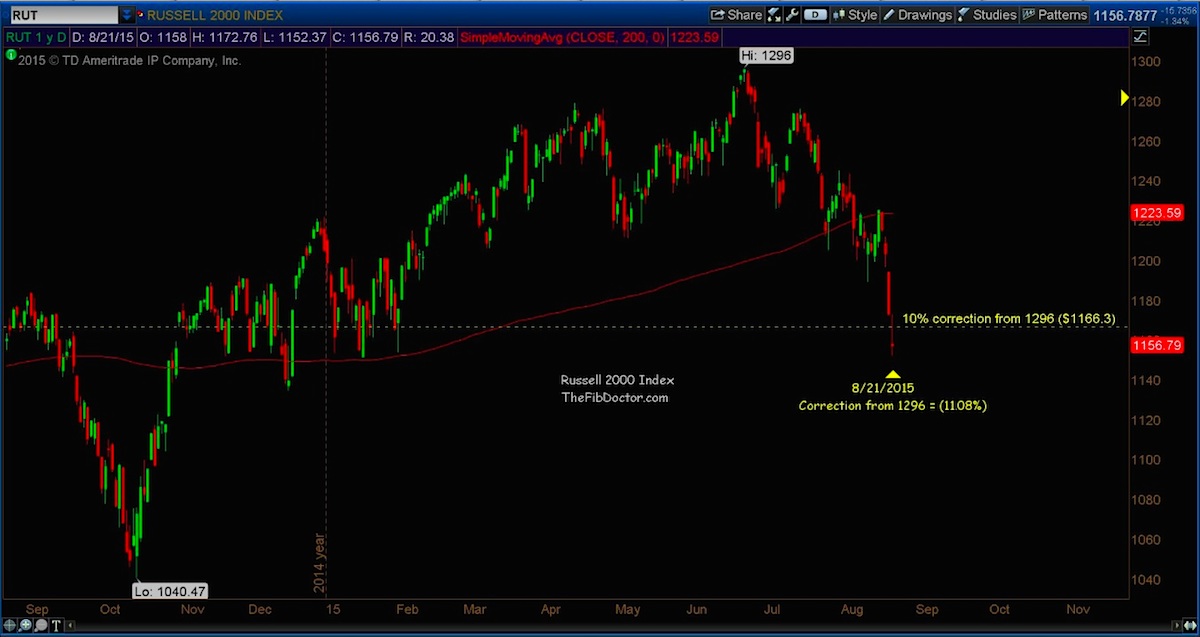
- Russell 2000 Index = (11.08%)
Notes are on the charts below. Click charts to enlarge.
Dow Jones Industrial Average – 1 Year Daily Chart
NASDAQ Composite – 1 Year Daily Chart
S&P 500 Index – 1 Year Daily Chart
Russell 2000 – 1 Year Daily Chart
Thanks for reading and remember to always use a stop loss order.
Twitter: @TheFibDoctor
No position in any of the mentioned securities at the time of publication. Any opinions expressed herein are solely those of the author, and do not in any way represent the views or opinions of any other person or entity.


