With stock markets in deep declines, traders need to stay cautious and adhere to their plans.
As the same time, it is smart to identify potential technical patterns and what if scenarios to help identify potential trend changes.
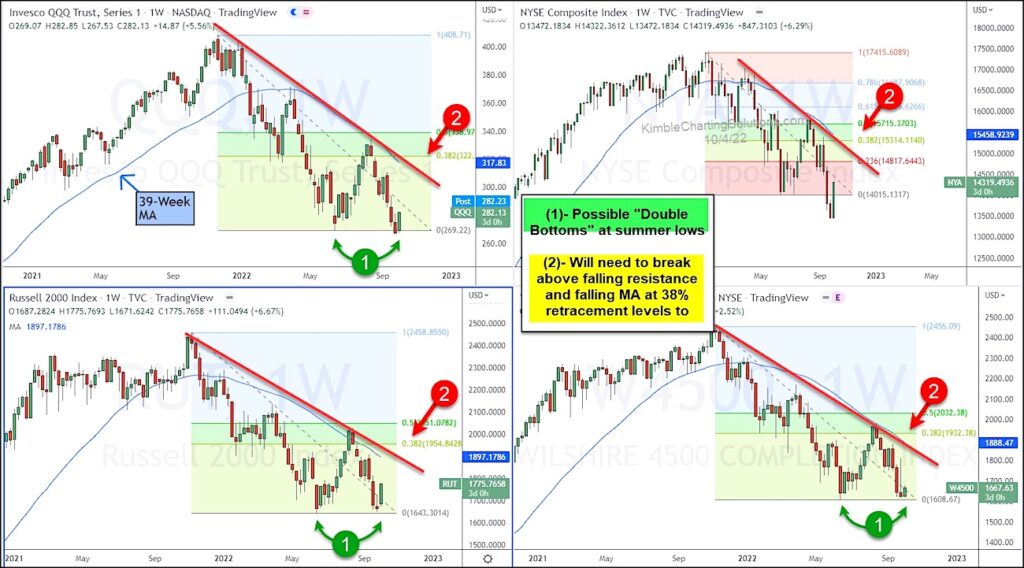
Today, we look at a chart 4-pack to identify potential double bottom patterns. The stock market indices shown below are the Nasdaq 100 ETF (QQQ), NYSE Composite, Russell 2000, and Wilshire 4500.
As you can see, these patterns have A LOT of work to do. Potential patterns can only be acted on by aggressive traders with tight stops. More importantly, traders/investors should ask, “what will confirm this pattern?” To that end, each of the 4 indices would need to clear the downtrend lines at each (2).
These downtrends are a key macro technical level across the 4 charts. Be safe and stay tuned!
Nasdaq 100 ETF, NYSE Composite, Russell 2000, and Wilshire 4500 Charts
Note that KimbleCharting is offering a 2 week Free trial to See It Market readers. Just send me an email to services@kimblechartingsolutions.com for details to get set up.
Twitter: @KimbleCharting
Any opinions expressed herein are solely those of the author, and do not in any way represent the views or opinions of any other person or entity.

: Showing Some Signs of Emerging Strength")
