Thursday’s strength helped the S&P 500 set a new all-time closing high in Futures, with the S&P 500 cash index (INDEXSP:.INX) falling a few ticks shy at 2187.12 (vs 2190.15 August 15 close). The NASDAQ Composite (INDEXNASDAQ:.IXIC) rose to within 6 ticks of its own All-time high close from September 29 (5339.23). Meanwhile, the Dow Jones Industrial Average (INDEXDJX:.DJI) has lagged over the last few days as the other stock market indices have played “Catch-up”. It is just shy of the 19,000 level.
Overall, this price action is certainly bullish, but I believe prices look to have risen a bit too far too fast. And this may lead to a Thanksgiving week stock market pullback (or pause).
While it was right to stick with the bullish trend this week, it now appears that at least a minor stalling out is likely which could cause some consolidation and even a minor pullback for stocks. And this may occur despite the Thanksgiving holiday right around the corner.
Several technical factors support such a stall out. Here are four of them:
1). Financials and Industrials both have gotten very stretched of late, and both combined represent about 25% of the S&P 500 Index. Given that Utilities, Telecomm, Real Estate, Discretionary, and Health Care are in downtrends, (another ~45%) it’s tough to expect that Technology can shoulder the whole load. This is more clear when one considers that the NASDAQ Composite has rallied to an area of importance, and appears likely to stall as well. Financial stocks look particularly vulnerable to at least some backing and filling before gains can continue.
2). The US Dollar Index, along with Global Sovereign yields look likely to stall out near-term. Both rallied during this equities rally and now any downturn might result in a similar backing off in the groups that rallied along with them. Commodities have suffered during the Dollar rally, but not nearly to the degree which might have been expected. Remember, the Dollar has rallied to new 13-year highs. Any snapback therefore in yields and the Dollar could very well coincide with an oversold bounce.
3). Counter-trend signs of exhaustion are widespread. Demark indicators such as TD Combo and TD Sequential show completed sell setups on quite a few equity indices along with sector ETFs based on Thursday’s close. (CCMP, NDX, INDU, SPX, SOX, KBE, XLF, XLI, KBE, IAI, KRE, XLE, XLY, among others) The S&P 500 December Futures contract has just signaled a TD COMBO 13 Sell signal along with the completion of its own TD Sell Setup.
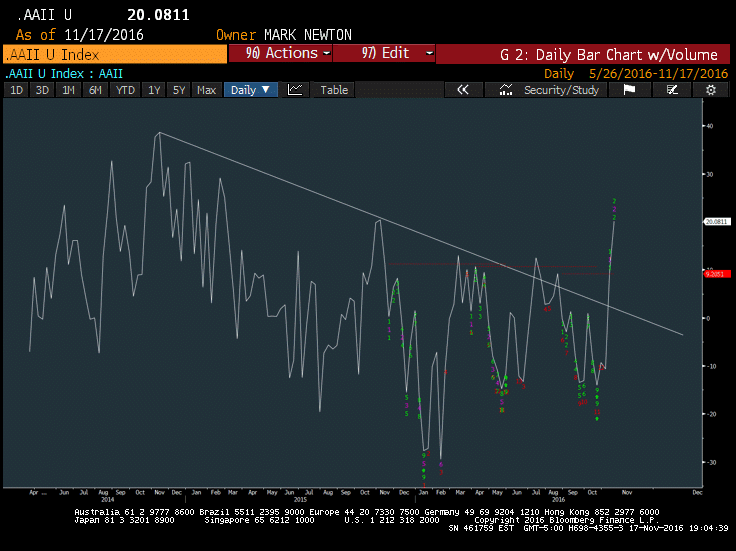
4). Investor sentiment has begun to grow a bit more bullish of late. From a contrarian perspective, this is a negative. The AAII Percentage Bulls just registered a 46.65% reading the highest since February. The AAII Percentage Bears now shows 26.57%. This 20% spread between Bulls and Bears is now the highest spread seen in all of 2016, and the highest since last November. At that time, equities peaked out coinciding with a similar spread back in early Nov 2015. The CNN Fear and Greed index has moved from Fear to Greed in the last week. This rapid shift in sentiment likely reflects the attitude that the coast is clear into year end with improving economic data and the Federal Reserve moving “Pedal to the Metal” towards a December interest rate hike. While sentiment based on other indicators doesn’t yet signal extreme optimism, the rapidity of this shift given some “hopeful optimism” around the President-Elect, etc. should be watched.
Note that this is a slice of my premium subscription research that went out this morning from Newton Advisor. Thanks for reading.
Twitter: @MarkNewtonCMT
Any opinions expressed herein are solely those of the author, and do not in any way represent the views or opinions of any other person or entity.


