 Lumber prices in the beginning of the year surged to a new all-time high of $411.50. In mid-March, Lumber prices began to plunge and fell -32% to $276.20. I did some digging into this steep drop and wanted to share a couple of quick correlation observations.
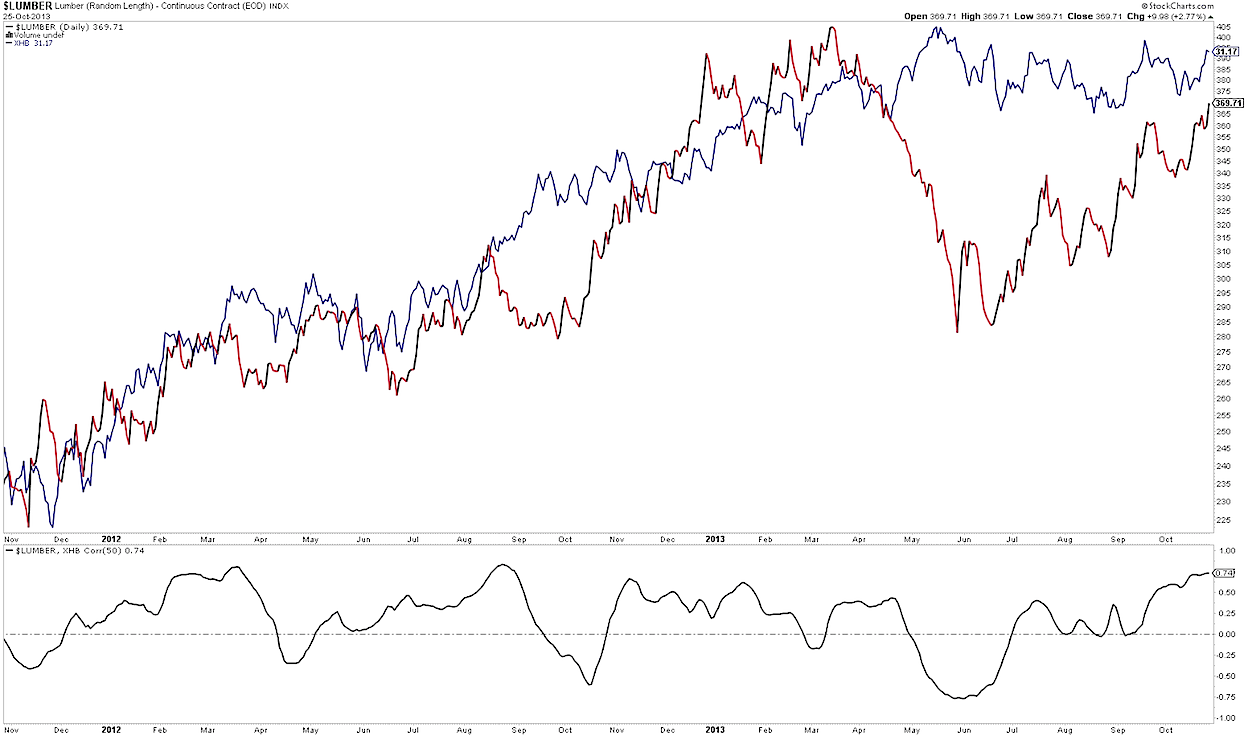
First and foremost, I found the divergence between the Homebuilders (XHB) and Lumber prices fascinating (during the drop). But flash forward, and note that the current 50 day correlation is the highest it’s been since 2012. See chart below.
Lumber Prices vs Homebuilders – 2 Year Chart
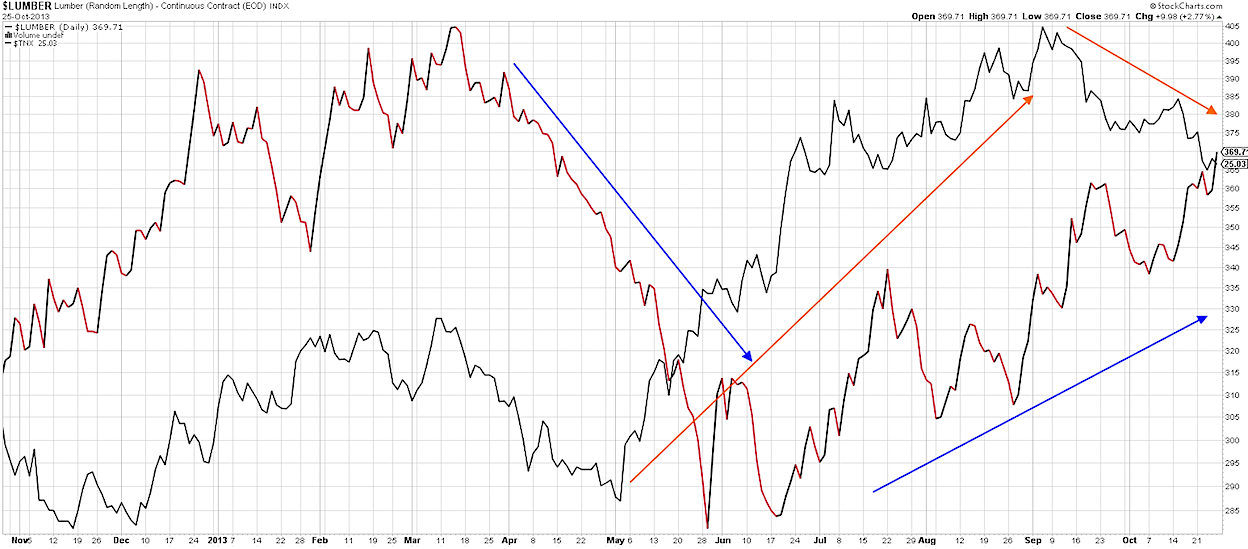
The next correlation (and chart) portrays the relationship between Lumber prices and the 10 Year Treasury Yield Index (TNX). Lumber prices started to decline much sooner than the significant rise in interest rates. And conversely, Lumber prices bottomed in late May and started to rise rapidly over the next few months; this rise preceded the [short-term] top in the 10 year yield on a similar time metric. Is this just a coincidence? Perhaps, but these correlations do call attention to the value of studying inter-market relationships. Trade safe.
Lumber Prices vs 10 Year Note Yield
Twitter: @stockpickexpert
The material provided is for informational and educational purposes only and should not be construed as investment advice. All opinions expressed by the author on this site are subject to change without notice and do not constitute legal, tax or investment advice. At Castle Financial, securities are offered through Cadaret, Grant & Co., Inc. and TD Ameritrade, Inc. Members FINRA/SIPC.
No position in any of the securities mentioned at the time of publication. Any opinions expressed herein are solely those of the author, and do not in any way represent the views or opinions of any other person or entity.


