Last Friday, I spoke on Women of Wall Street Twitter Spaces and Fox Business Making Money with Charles Payne to talk about a key monthly moving average.
What makes this moving average so important right now, is that three of the Economic Modern Family members are testing it.
The three members, Granddad Russell 2000 (IWM), Grandma Retail (XRT) and Transportation (IYT) well deserve their status as what Stanley Druckenmiller calls the “inside” of the U.S. economy.
In fact, the components of the modern family were put together before we heard Druckenmiller’s viewpoint.
We have observed how predictive they all are in helping us see in advance the next big market direction.
Hence, these “inside” indicators-right now-are all sitting just above a 6–7-year business cycle low.
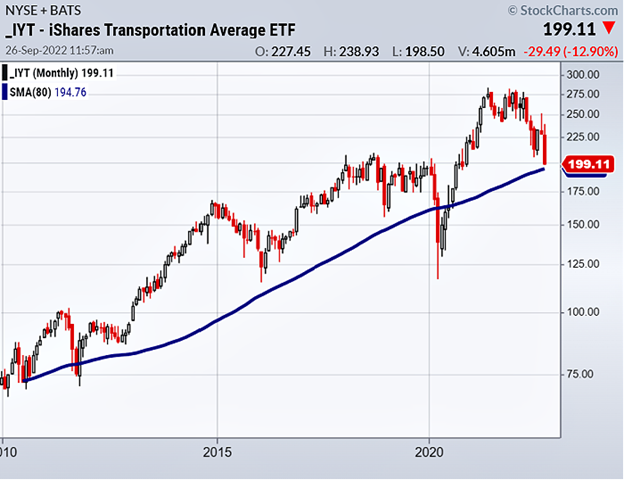
For the purposes of this daily and because we have featured this sector a lot lately, the chart of IYT is a perfect example of this moving average and what to watch for.
Except for the brief blip in 2011 when the government shut down, and then again during the pandemic, IYT has sat above the dark blue line for 11 years.
Currently, that line sits at the 195 area.
Same is true with IWM and XRT-both marginally holding their monthly MAs.
So, watch IYT to either hold and begin a rally possibly back closer to 220.
Or, for IYT to fail 195 in which case we see the whole market selling off further.
To note, the other family members such as Sister Semiconductors (SMH) and Prodigal Son Regional Banks (KRE) are still sitting well above the monthly MA.
Big Brother Biotechnology (IBB) however, is now trading below it. And not in the family but notable is the REIT sector (IYR) also sitting below it.
SPY has the same MA only, that one sits at 310 (a long way off).
Incidentally, junk bonds broke down under this moving average in November 2021. The market has been slow to take junk bond’s clue.
Mish’s Upcoming Seminars
ChartCon 2022 Stockcharts October 7-8th Seattle.
Join me and 16 other elite market experts for live trading rooms, fireside chats, and panel discussions
Stock Market ETFs Trading Analysis and Summary:
S&P 500 (SPY) Testing the previous low 362 support and 370 resistance
Russell 2000 (IWM) Broke the June low of 165.18 – 162 support and resistance 170
Dow (DIA) Broke June low – Support at 289 and resistance at 298
Nasdaq (QQQ) Testing the June low – Support at 269 and resistance at 280
KRE (Regional Banks) Relative outperformer – 57 support and resistance at 61
SMH (Semiconductors) 187 support and 194 resistance
IYT (Transportation) 196 support and 200 resistance
IBB (Biotechnology) 112 support and 118 resistance
XRT (Retail) Support at 55 and 60 resistance
Twitter: @marketminute
The author may have a position in mentioned securities at the time of publication. Any opinions expressed herein are solely those of the author and do not represent the views or opinions of any other person or entity.


