Another important rotational move among sectors is occurred Friday with Technology moving back to (or towards) new All-time Highs. Various Technology sector indices are hitting new all-time highs on weekly charts (close), while others are are within striking distance of new highs on daily charts.
The Technology Sector (NYSEARCA:XLK) has outperformed all other sectors outside of Real estate in the last 5 trading days. Large cap tech stocks leadership appears to be a major factor in this latest move higher.
This is good news for investors as the Technology sector had been lagging a bit. It now seems to have found its stride. The Semiconductors Sector made its move to new highs yesterday and now the NASDAQ 100 (NDX) and PowerShares QQQs ETF (NASDAQ:QQQ) are knocking on the door.
That said, in looking at the charts below, it is clear that large cap tech stocks leadership is aiding this move higher. Below are a series of charts showing this dynamic. Large cap tech is breaking out vs the S&P 500, while equal weight tech is grinding a bit. For those who like to position ahead of moves instead of waiting for a dip after the breakout, I think the XLK should lead to breakouts for broader Technology. But for now, it still pays to be selective.
Tech stocks of particular interest to me given Technical patterns (buy-the-dip candidates): AVGO, GOOGL, AAPL, TXN, XLNX, ADI, MU, FFIV, FLIR, APH, MSFT, CTXS, INTU, NTAP, YHOO, EBAY.
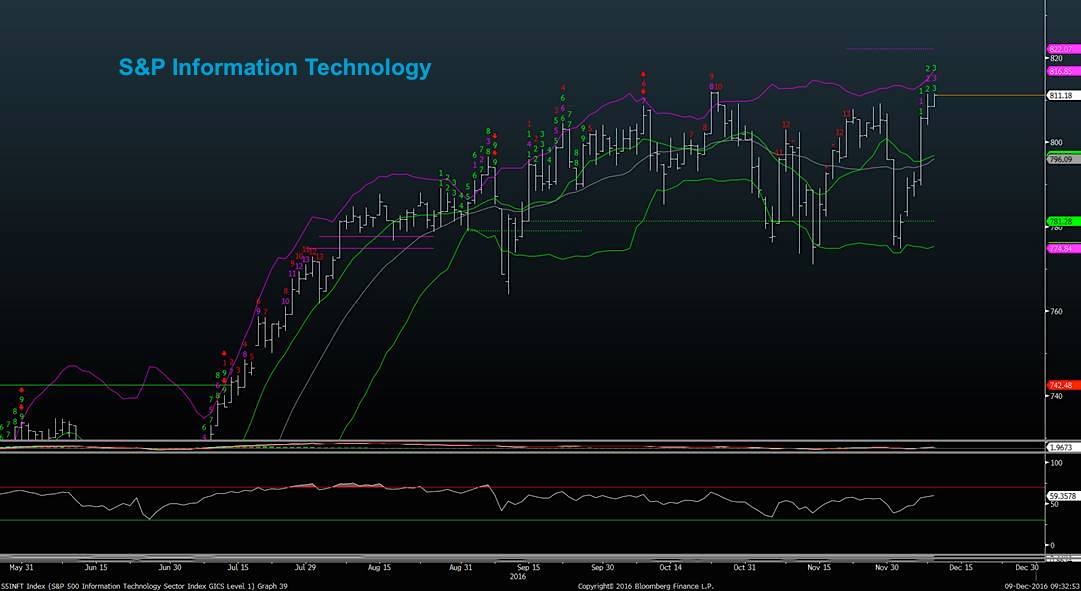
S&P Information Technology Index Chart
The S&P Information Technology Index made a new all-time closing high this week above the highs last hit on 10/24.
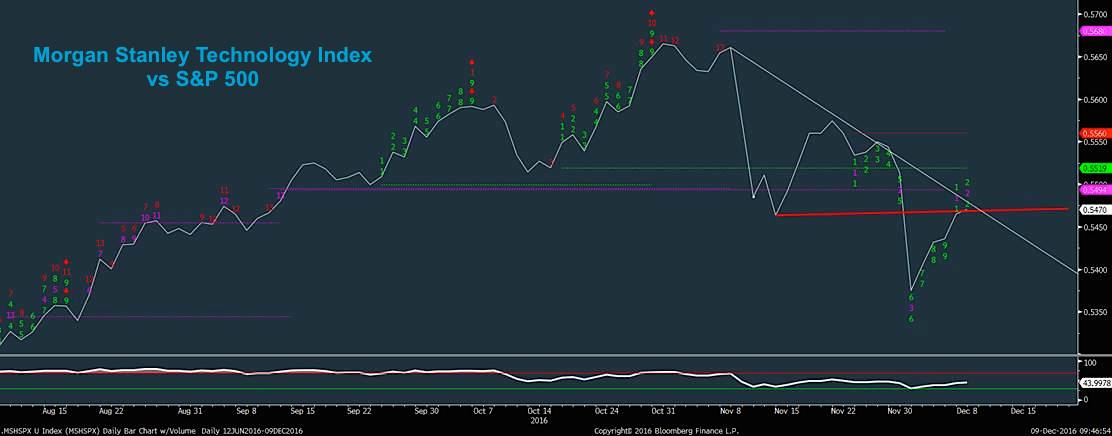
Morgan Stanley Technology Index vs S&P 500 Relative Strength Chart
The Morgan Stanley Technology Index (MSH) vs SPX shows Tech NOT YET having broken out. But its on the verge of breaking out after this bounce. I expect this to happen as NDX breaks out to new highs.
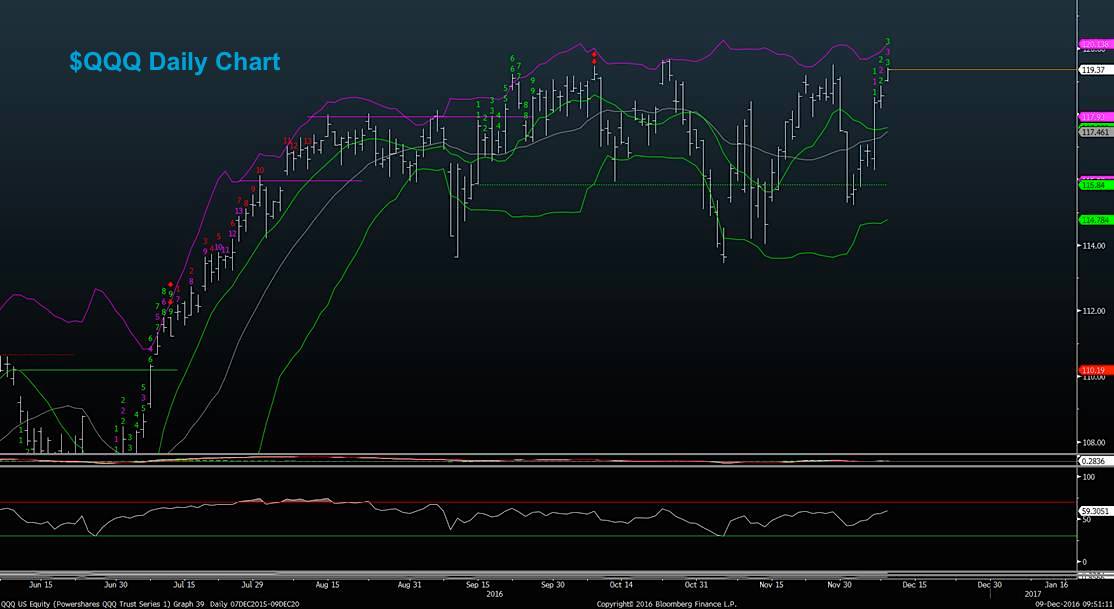
PowerShares QQQ’s Daily Chart (Nasdaq 100 proxy ETF)
QQQ’s are closing in on highs.
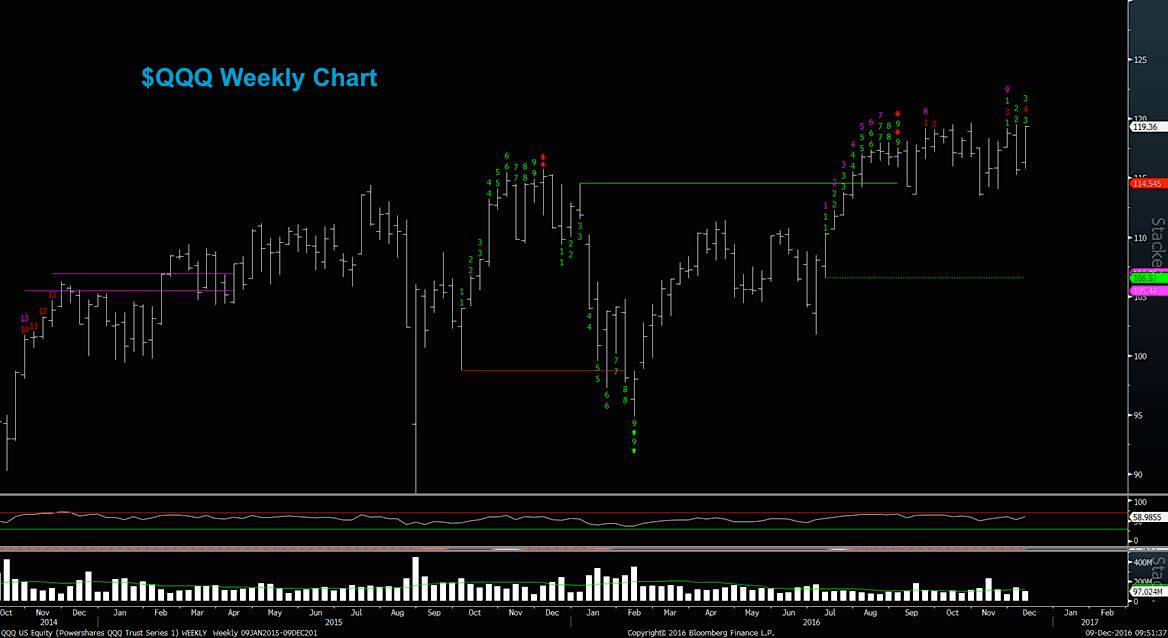
PowerShares QQQ’s Weekly Chart
After a lengthy period of sideways grinding, it’s nice to see it emerge back to its highs (and hopefully above). In my opinion, this will jumpstart the outperformance for the Technology Sector.
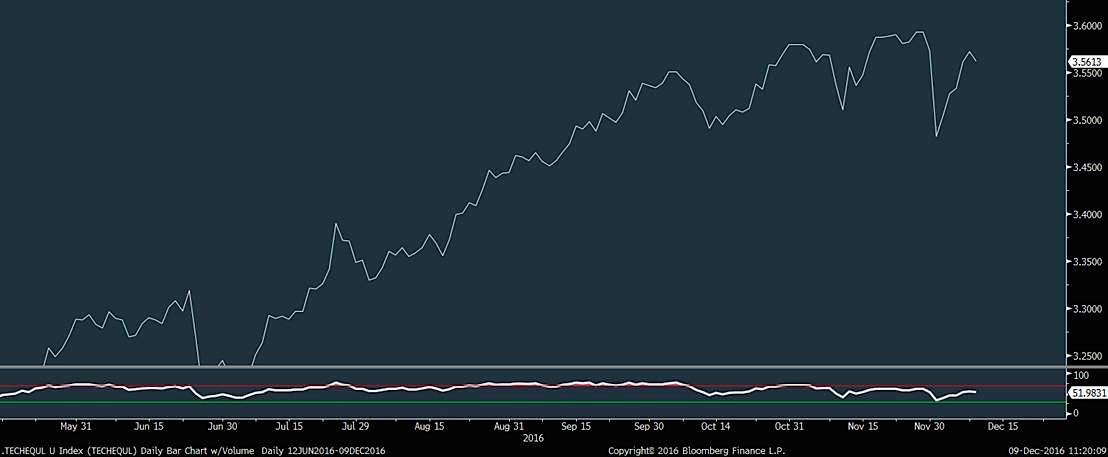
Equal Weighted Technology Chart
Equal weighed tech has not broken out vs the S&P 500 and is grinding near its highs. So for now, it looks to be large cap tech stocks that are making the move. And until this ratio moves back to new highs, it will be important to be selective.
Note that you can catch more trading ideas and insights from me over at my site, Newton Advisor. Thanks for reading.
Twitter: @MarkNewtonCMT
Any opinions expressed herein are solely those of the author, and do not in any way represent the views or opinions of any other person or entity.

: Showing Some Signs of Emerging Strength")

