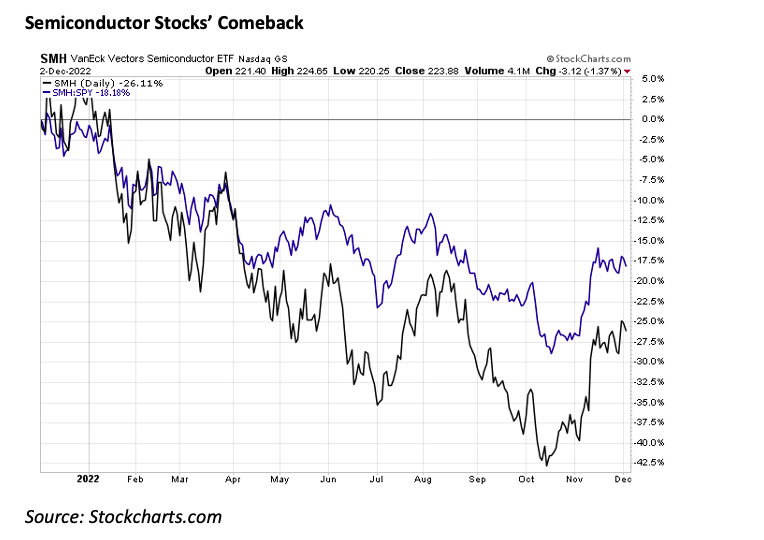
- Semiconductor stocks have rallied big off the market’s October low.
- One way to play a near-term consolidation or bullish take on the space is with a short put spread.
- Lam Research features an attractive valuation and a favorable risk to reward setup, and we outline an options play on this chips name.
Shares of Lam Research are at attractive valuation levels and we see opportunities in its options.
Call it a chip comeback. The VanEck Vectors Semiconductor ETF (SMH) has outpaced the S&P 500 ETF (SPY) since mid-October. Generally decent industry earnings reports despite dire fears, some optimism in China in recent weeks, and lower interest rates have all been tailwinds for the embattled semiconductor industry.
Some of the group’s biggest stocks have seen major snapbacks, but many investors wonder if it is yet another bear market rally. Today, we’ll look at one name that is reasonably valued, features a somewhat bullish chart, and has attractive options to play from the neutral to long side.
Semiconductor Stocks’ Comeback
Fundamental Focus
Let’s dive into the fundamentals and, later, the technicals and options, of a neutral to bullish trade on Lam Research.
Lam Research Corporation (LRCX) designs, manufactures, markets, refurbishes, and services semiconductor processing equipment used in the fabrication of integrated circuits. It’s a leading supplier of wafer fabrication equipment and is an important player in servicing chip companies. The systems Lam Research helps facilitate allow the chip industry to produce smaller, faster, and better-performing semiconductors. Samsung, Taiwan Semi, and Intel are some of its largest customers.
While Bernstein recently cut its estimates on fab equipment spending, due in large part to concerns out of China, we see re-opening news out of the world’s second-largest economy as positive for the stock that has not yet been reflected in forward estimates. There’s no doubt that 2023 will be a tough year for international growth in the industry, but the valuation situations suggest much of the bad news may be priced in. Moreover, offsetting capacity increases away from China is a boon to Lam Research along with domestic spending plans care of the U.S. CHIPS Act.
After a tumultuous couple of years and more uncertainty ahead, LRCX remains the second-biggest semiconductor capital equipment company, according to Bank of America Global Research. Its unique industry position should allow the firm to weather economic uncertainty due to less cyclical exposure compared to its peers. Improved pricing in the chip space and loosening supply chains are potential tailwinds. Back in November, BofA noted that the bull case for semiconductors had become “compelling.”
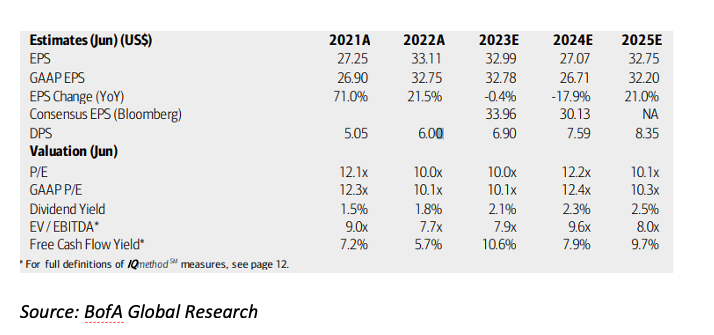
On valuation, earnings growth is seen as being difficult in the next two years before a 2025 rebound in forecast per-share profits. Dividends, meanwhile, are expected to grow in the coming years. With forward operating and GAAP P/Es in the low teens and a below-market EV/EBITDA multiple, the stock appears to have priced in a lot of negativity. Finally, LRCX boasts a strong 10% free cash flow yield using 2023 estimates. Overall, with shares almost 40% off the high from almost a year ago, there appears to be value in LRCX.
LRCX: A Dismal Profit Outlook, But Shares Attractively Priced
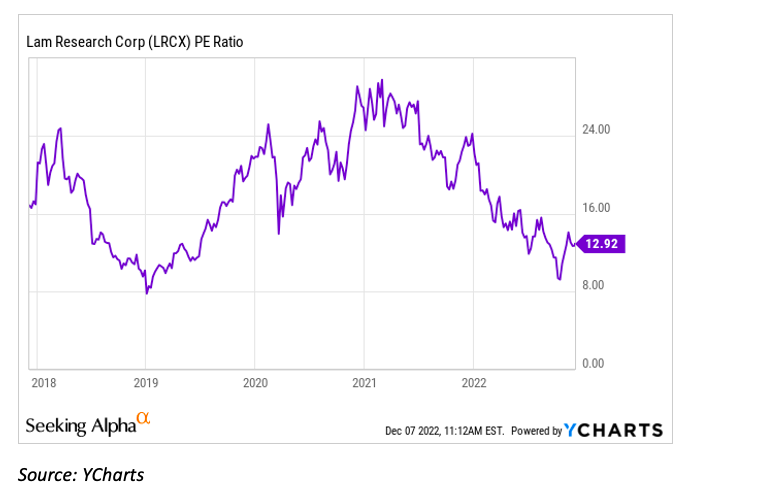
Looking further into the valuation and fundamentals, we find that Lam Research trades at a very reasonable 12.9 P/E – that’s a 23% discount to its historical 5-year average. Moreover, LRCX sells for under 11 times its forward EV/EBTIDA multiple – a more than 30% discount to its sector median. While the price-to-book ratio is high, above 7, we like the stock here given the sizable pullback.
LRCX: A Low P/E Relative to the Stock’s History
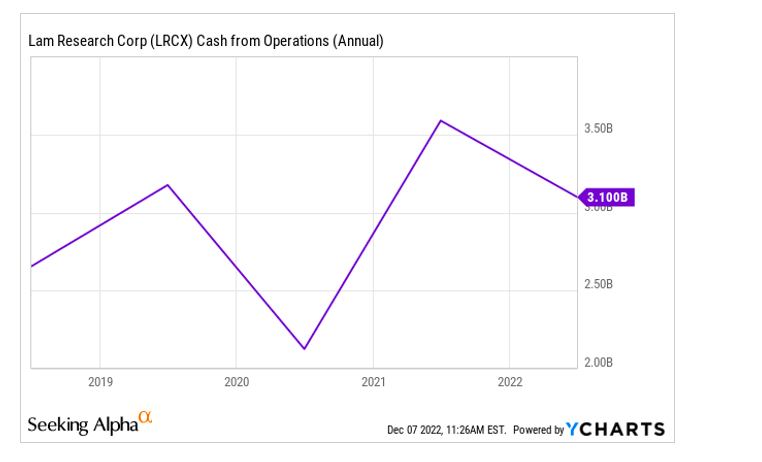
Where Lam Research stands out is its profitability situation. With an A+ rating from Seeking Alpha, strong margins and high free cash flow are valuable features in today’s risky market. The firm’s EBIT margin over the past four quarters is high at 31.7% compared to just 6.6% in the I.T. sector. That robust margin is also much higher than its 5-year average, suggesting that recent macro headwinds are not as big of an issue for LRCX as they are for some of the company’s peers. Finally, cash flow is in demand across the marketplace currently, and Lam Research generated a high $3.1 billion of cash flow from operations in the last year.
Lam Research: A Cash Cow
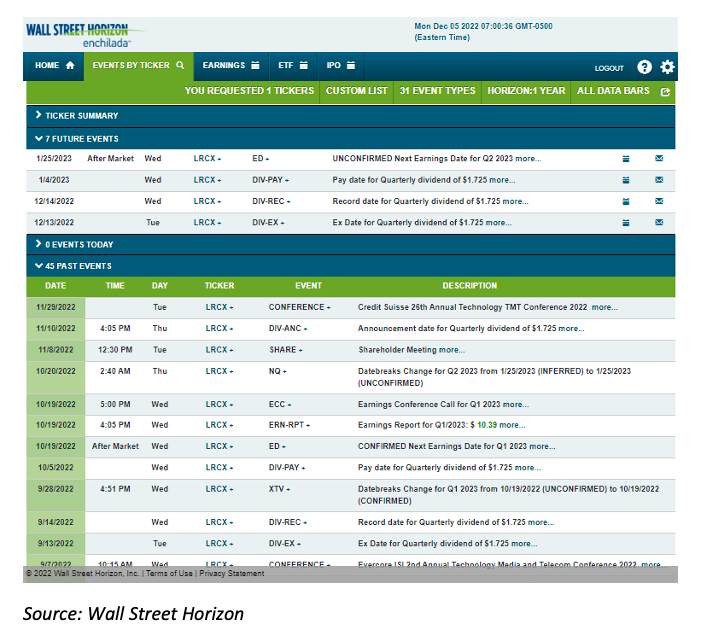
Looking ahead, there are no major volatility catalysts in the coming two weeks. The next earnings date is unconfirmed for Wednesday, January 25 AMC.
Corporate Event Calendar
Income Options Trade
For stocks such as Lam with strong underlying fundamentals that trade at reasonable valuations, and have a good technical setup, we can develop options strategies that are advantageous. We can scan for favorable risk/reward plays with key price levels to watch. These trades may be shorter duration than our fundamental and technical outlook, but we can repeat the options trades until the opportunities disappear. The options trade for this particular set up is a bullish short-put spread with limited risk. Overall, we are looking to find the best options value based on the historical distribution of stock price returns.
How We Found the Idea
With a focus on value, liquidity, and stocks without a near-term earnings event, we screened for equities with trailing and forward price-to-earnings ratios between 10 and 25 – that rejects non-profitable firms, possible value traps, and shares that are too richly priced. We also wanted to home in on companies that are still valued highly by the market, so we filtered for those with price-to-book ratios above 5. Of course, with options, volatility is important, so we included only companies with an earnings announcement more than a month away. Finally, market caps larger than $20 million and firms with more than 5,000 employees were considered.
Short Put Spread Characteristics & Definitions
- Risk to reward is less than 7 times
- The risk to reward is the maximum loss of the spread divided by the premium collected by selling the spread.
- Probability of profit is greater than 80%
- The probability of profit is the total area under a distribution that results in a positive return of the spread. The distribution is built by observing stock price changes historically.
- The market width of the options prices is less than 17% of the stock price.
- The market width of the trade is the total ask minus bid of the long and short puts.
- Delta of less than 0.1
- The delta is the estimated profit from a $1 increase in the stock price.
- We then sorted by a combination of reward to risk, probability of profit, and expected return versus price of the spread.
- The expected return of the spread is the value at each point in the distribution times the probability at that point.
Survey Says: Lam Research
The top result was a bullish short put spread on LRCX expiring on December 16. The $410 and $405 strikes are used. With a risk to reward ratio of 1:5.2 and a high probability of profit of 87.2%, the trade looks good for those with a near-term time horizon. The max gain is $80 while the max loss is $420 as of near the close on Friday, December 7. The delta is low at just 0.03 and the market width is $0.40 total for both options in the trade. In all, you collect $0.80 of premium at the onset of the trade and would obtain this max gain so long as the stock is at or above the break-even price of $409.20 representing the short higher strike put at expiration less the credit received.
The profit and loss distribution illustrated below shows that shares can pull back further before losses are incurred.
Short Put Spread: Where You’ll Make Money
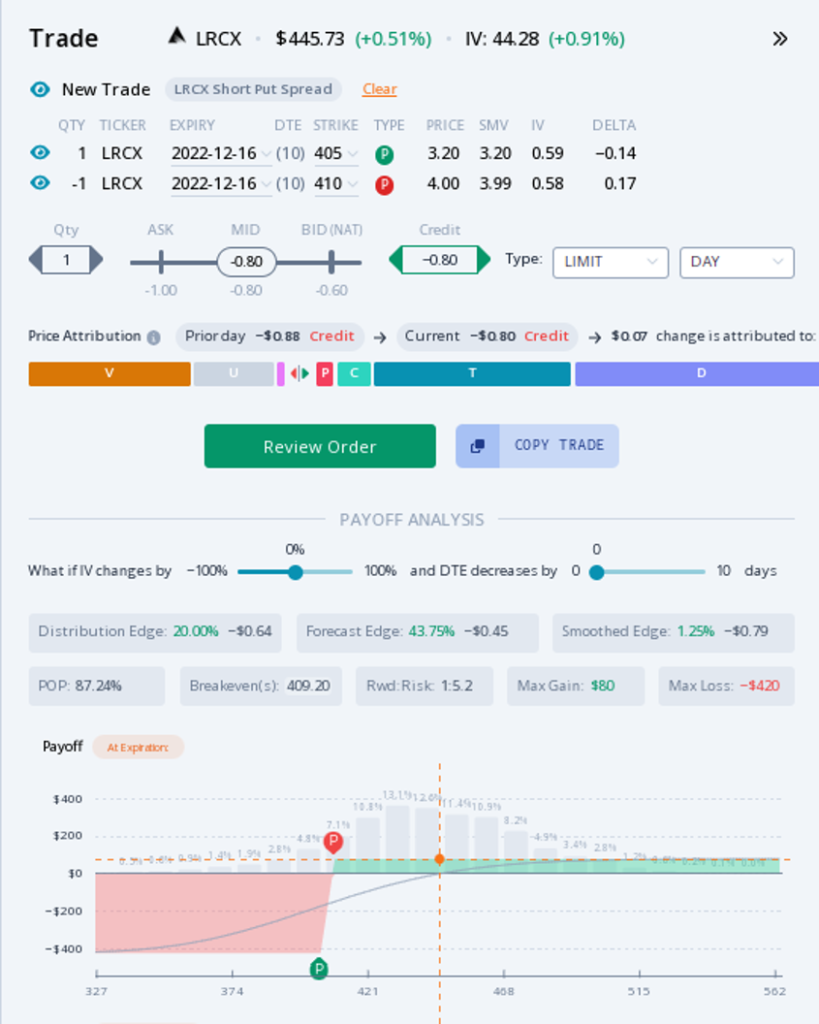
Source: ORATS
The Technical Take
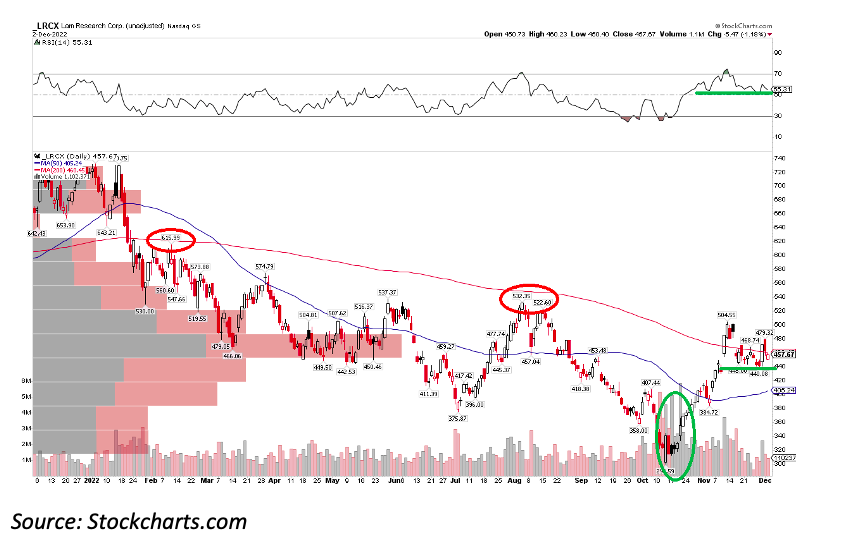
LRCX has recently rallied to near its declining 200-day moving average. Shares poked above that important trend indicator last month, but then wavered back below it on light volume recently. Notice in the chart below that the stock has found some near-term support near $440 – there is a mid-November gap there that was filled and successfully defended in recent days.
Also, the stock featured a major winning streak during the back half of October around and following its earnings report on the 19th of that month. The share price surge off the $300 level came on impressive volume. All told, the rally was nearly 70% to the mid-November peak, and the current consolidation, which has the hallmarks of a bull flag, should promote the chance of more consolidation above the high strike put outlined in the trade idea.
LRCX: Near-Term Support Near $440, Bull Flag?
The Bottom Line
Lam Research shares are taking a breather after a monster rally off the October low. The corrective pattern comes on low volume with support at $440. Options traders can play this trend with a short put spread using the $410 and $405 strikes expiring December 16.
Twitter: @MikeZaccardi
The author may hold positions in mentioned securities. Any opinions expressed herein are solely those of the author, and do not in any way represent the views or opinions of any other person or entity.


