By now, I hope you listened to the 36-minute interview I did early last week with Maggie Lake.
In case, link to the interview.
“[It’s] all hands on deck for energy,” Mish said. “Every source of energy is needed.”
And yet, the bears emerge talking that an oil boom is underway with no real shift in fundamentals.
I’ve traded commodities during Middle East crises-and remember, price dictates the narrative.
With that said, the Economic Modern Family has yet to steer us in the wrong direction.
If oil, gold, silver, uranium and now soybeans are telling us anything about too much inflation complacency, we will see it in the Family.
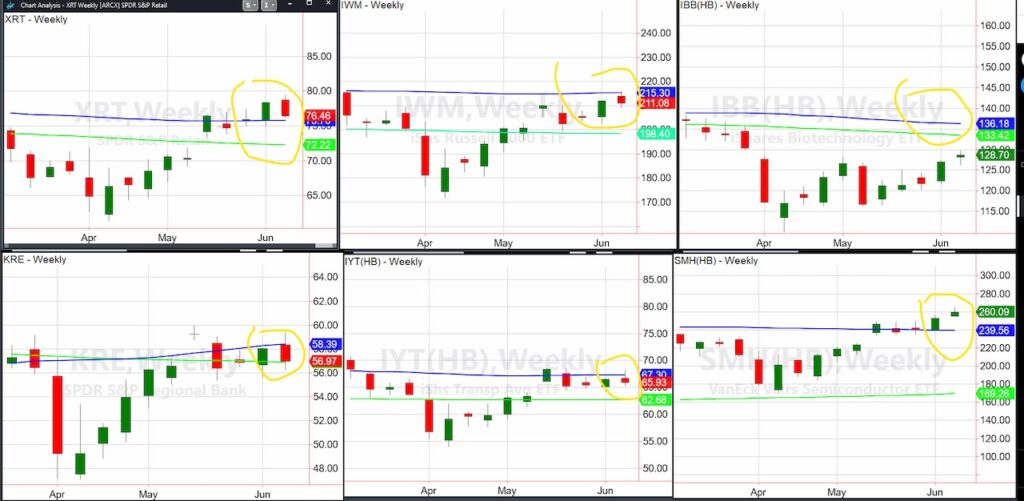
While the charts at the top of this article show the Retail Sector ETF (NYSEARCA: XRT) on a weekly basis, let’s also have a close look at the Daily chart because this sector has led and has to stay in the game with geopolitics bubbling up.
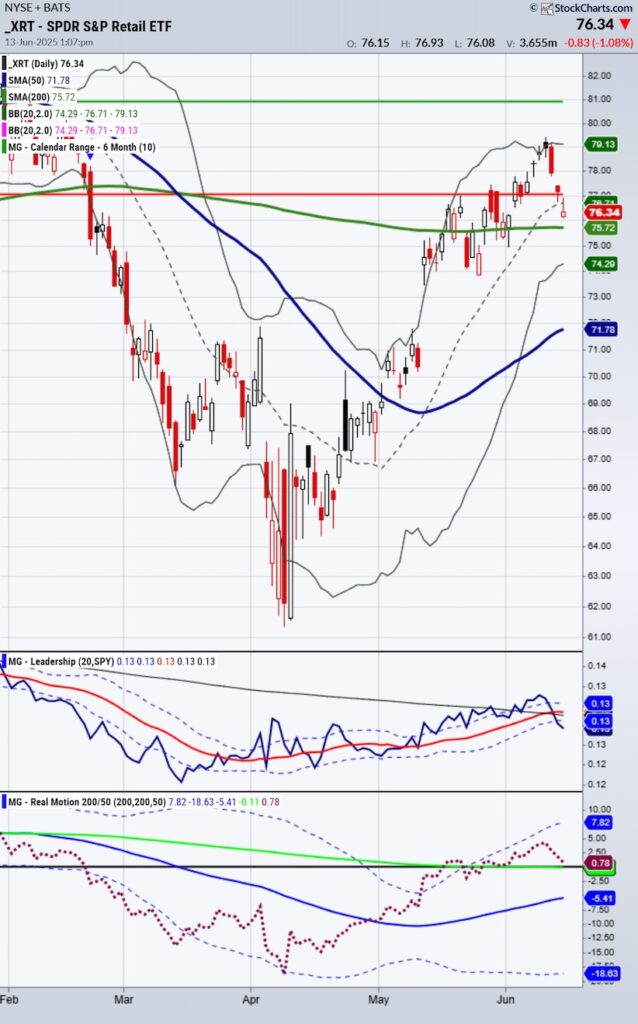
The Retail Sector ETF (XRT) on a weekly chart is still above the 50-Weekly Moving Average (WMA) in blue, provided it holds above the price $75.50.
On the Daily chart, however, we can see the gross underperformance against the benchmark. Plus, the support at the 200-Day Moving Average (DMA) and the support on real motion at the same DMA confirms the importance of this level.
The second sector above the 50-week moving average is the Semiconductors Sector ETF (NASDAQ: SMH).
$240 is where the 50-WMA sits on the weekly chart.
On the Daily:
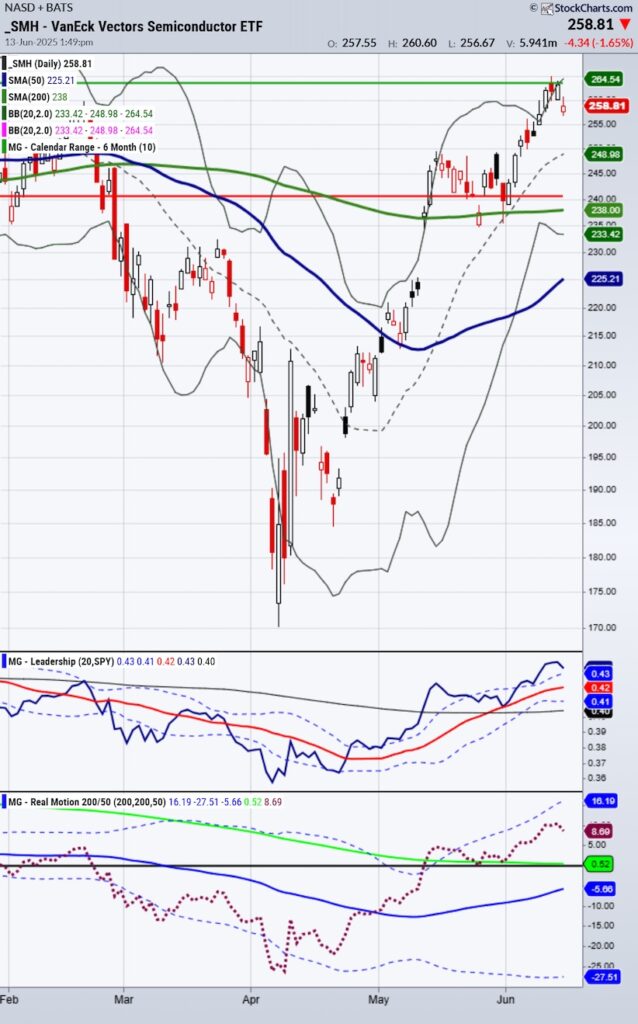
While the Semiconductors Sector ETF (SMH) stopped dead in its tracks at the January 6-month calendar range high (still applicable until the rest in July), both the weekly and the daily charts exemplify the leadership in chip and growth stocks.
The Retail sector can correct and break down, but we would view this as a correction and not a trend reversal UNLESS, SMH also breaks down under that $240 level or under the 200-DMA (green line).
As for the rest of the Family:
The Russell 2000 IWM rejected the 50-WMA.
So did Transportation IYT and Regional Banks KRE.
The Biotechnology Sector ETF (IBB) has not been able to clear either the 50 or 200-week moving averages.
Interestingly though, and why I have talked a lot about this sector on the media is not only because of my belief in the pharma companies making diet drugs, but also because
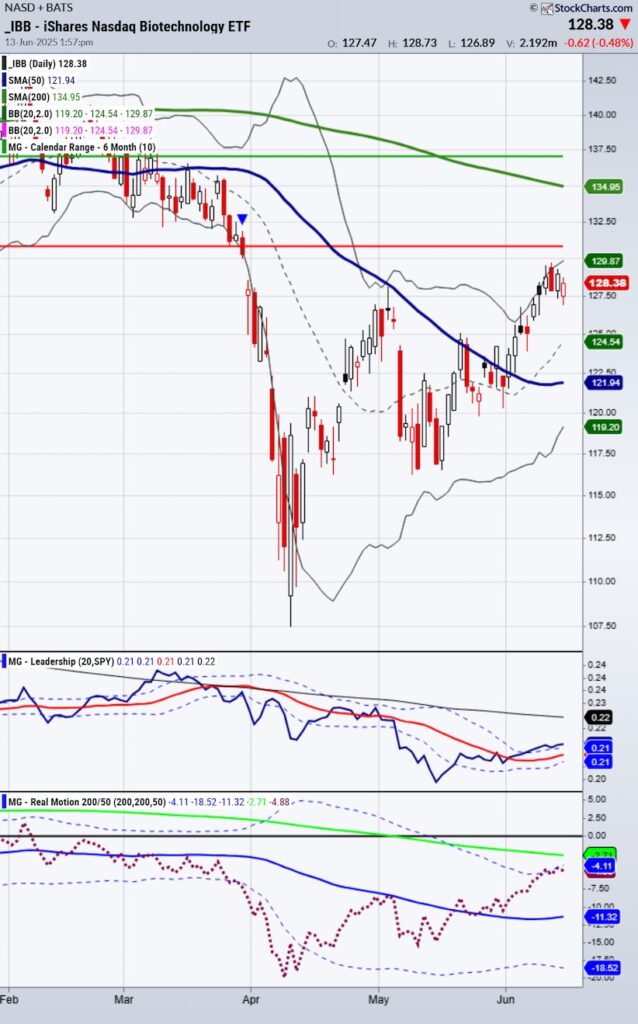
IBB is outperforming the benchmark (SPY).
Real Motion illustrates momentum improving.
And, price is now in a recuperation phase, above the 50-DMA with the strong relative outperformance telling me, one move above $130 or the January 6-momth calendar range, could send this sector higher still.
Putting it differently, Biotech is performing relatively well during this overall market correction and could therefore play some real catch up when the market stabilizes.
Going into this week the playbook is:
- Watch Granny Retail-a failure of those key levels, spells more trouble for IWM IYT KRE.
- Watch Semis SMH-if it pulls above $260 follow growth stocks. If it holds $240 buy dips, and if it fails $240 prepare for a bigger sell off.
- Watch IBB-the opportunities in this sector appear to be ripe.
Twitter: @marketminute
The author may have a position in mentioned securities at the time of publication. Any opinions expressed herein are solely those of the author and do not represent the views or opinions of any other person or entity.

: Where’s the Deflation in This?")


: Where’s the Deflation in This?")
