Stocks have been tumbling lately and several indexes are trading in oversold territory on a short-term basis. BUT, the bigger picture continues to be troubling.
And one trading ETF / indicator that highlights this is the popular Junk Bond ETF (JNK).
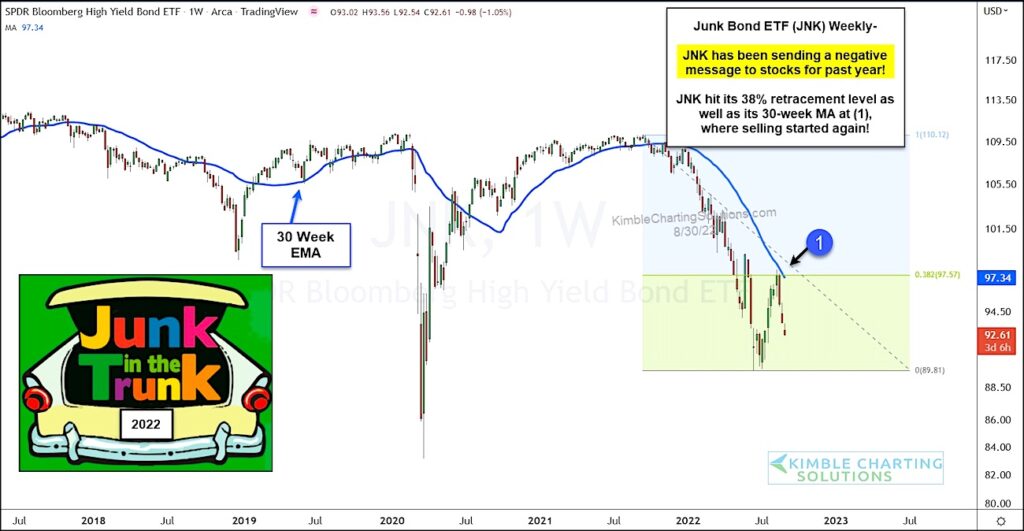
Below is the “weekly” chart and, as you can see, it has been in a firm downtrend this year.
Junk bonds are important as they represent investors willingness to take on risk. So when they sell off as bad as we have seen this year, it’s a warning.
Looking at the chart, we can see that $JNK rallied back to its 38.2% Fibonacci retracement level (as well as its 30-week MA) at point (1). But that was as far as the rally would go. 3 weeks of heavy selling have sunk $JNK and this is a broader warning that the intermediate-term picture is not healthy.
All together, the market is oversold on a short-term “trading” basis, but the bigger picture is still very concerning. Bears are in charge as long as price trades under point (1)… Stay tuned!
$JNK Junk Bonds ETF “weekly” Chart
Note that KimbleCharting is offering a 2 week Free trial to See It Market readers. Just send me an email to services@kimblechartingsolutions.com for details to get set up.
Twitter: @KimbleCharting
Any opinions expressed herein are solely those of the author, and do not in any way represent the views or opinions of any other person or entity.


