The credit markets are a very important measure to monitor and watch with regard to the success (and failure) of the equity markets. They are also a good indicator of future volatility in the financial markets.
A correlation exists where deterioration within the Junk Bonds market usually leads to, or portends, weakness in the equity market and/or an increase in volatility.
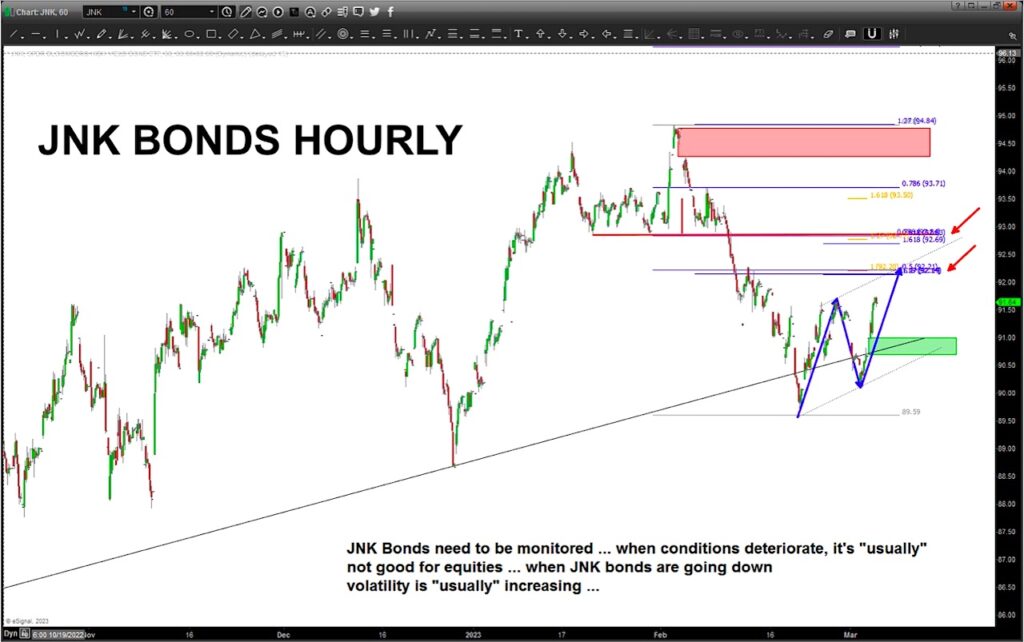
We have a VERY important pattern appearing on the hourly Junk Bonds ETF (JNK) chart below… it’s a “near perfect” Gartley Sell Pattern.
Looking at the chart below, the two red arrows are showing the expected levels for resistance and, quite possibly, the beginning of the next leg down for junk bonds.
If we get a strong close above the 93.71 level then I would consider this a PATTERN FAILED. Above the old high at 94.84 and I suspect a strong and continued rally in equities.
This is one of those big flashing lights to monitor over the coming week. How this pattern resolves will likely point to the next move in equities.
$JNK Junk Bonds ETF Chart
Twitter: @BartsCharts
Author does not have a position in mentioned securities at the time of publication. Any opinions expressed herein are solely those of the author, and do not in any way represent the views or opinions of any other person or entity.

: Worrisome to Broader Market?")
