If there’s any developed market evocative of the shift in tone between 2013 and 2014, it’s Japanese Equities. After a blistering 57% rise (it’s best in 4 decades), the Nikkei has slid -14% YTD (v. the S&P 500’s 1.7% gain). But the Japanese markets are deeper and more complex than a headline number; clearly more research is necessary.
The complex array of policy variables winding their way down-channel in the Japanese economy (viz., Abenomics – including April’s massive sales tax hike – and the Bank of Japan’s radical QE program) seem more or less responsible for last year’s outlying equities performance; but whether this year’s laggard return is a function of superficial mean reversion or crippling second thoughts after last year’s policy honeymoon period is completely up-in-the-air.
Whatever the case, Japanese stocks and the Japanese Yen are speaking; and while the message of the Japanese markets is dynamic and therefore ambiguous, a look at the long-term view across the aforementioned asset classes suggests Japan hasn’t hit the economic escape velocity it’s bureaucracy’s stimulative efforts are designed to produce.
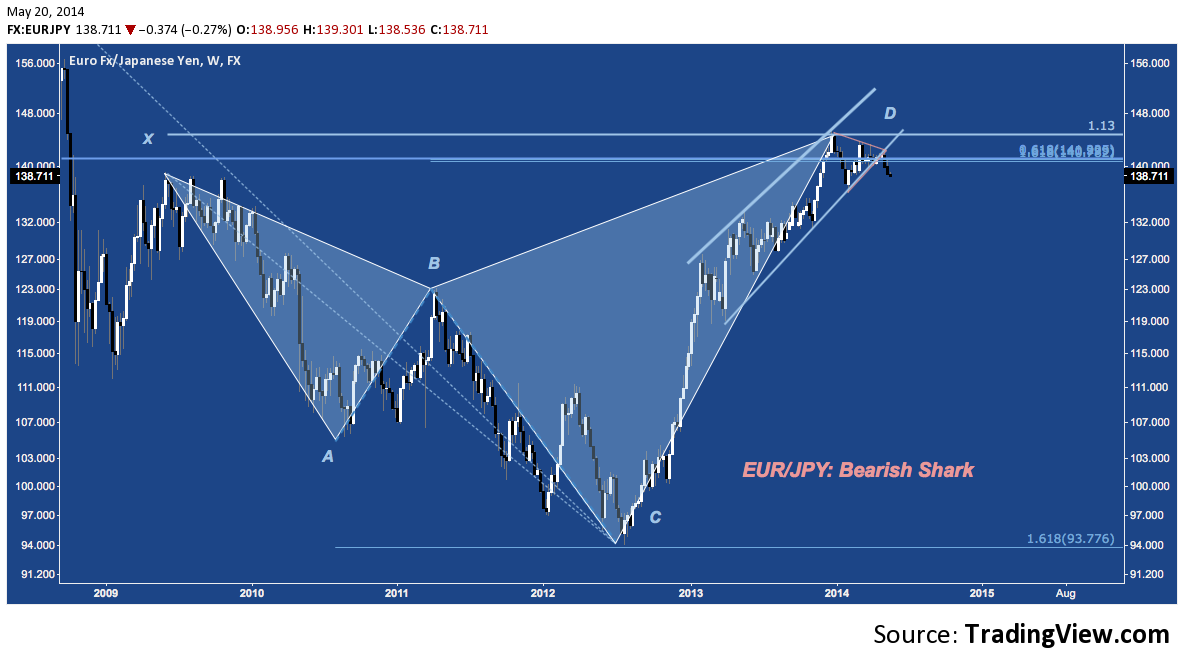
Following the BoJ’s 2012-2013 “race to debase”, the Japanese Yen (JPY) entered a multi-month consolidation at major cyclical (3-6 year) resistance. Now, contrary to the inflation-inducing policies undertaken in Japan, the Yen is strengthening. Take a glance at it’s recent performance across some key Japanese Yen cross pairs:
EUR/JPY: Lower From Symmetrical Triangle & Rising Channel Support After Tagging 5-Year Harmonic Resistance
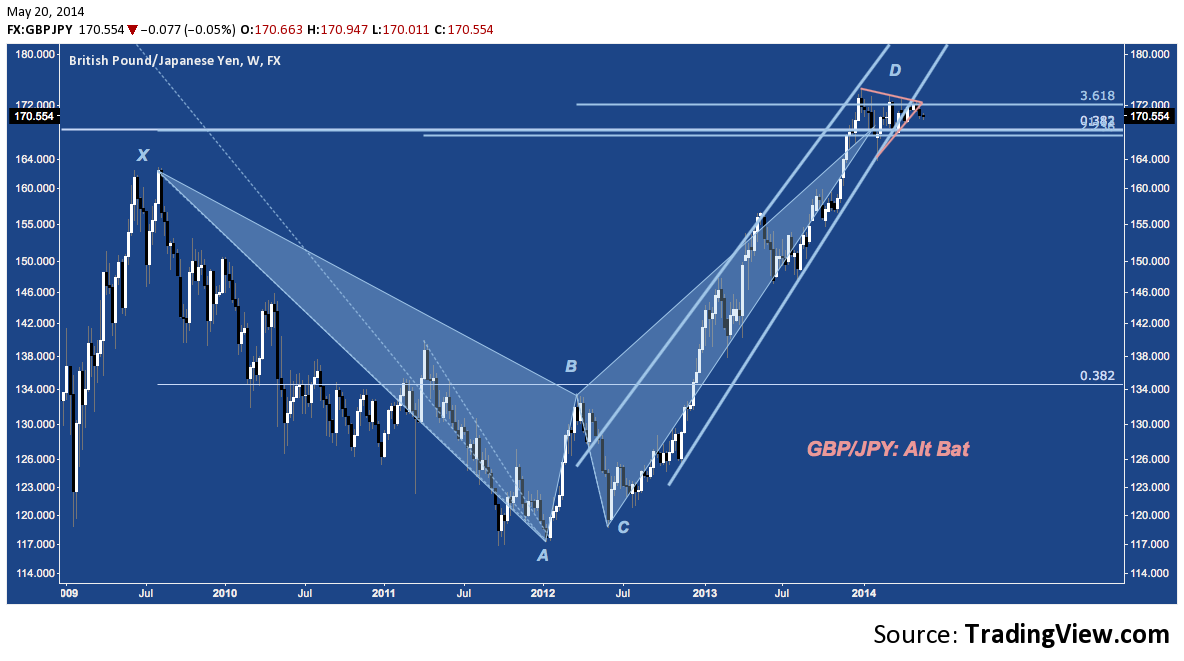
GBP/JPY: Lower From Symmetrical Triangle & Rising Channel Support: Inside 5-Year Alt Bat Reversal Zone
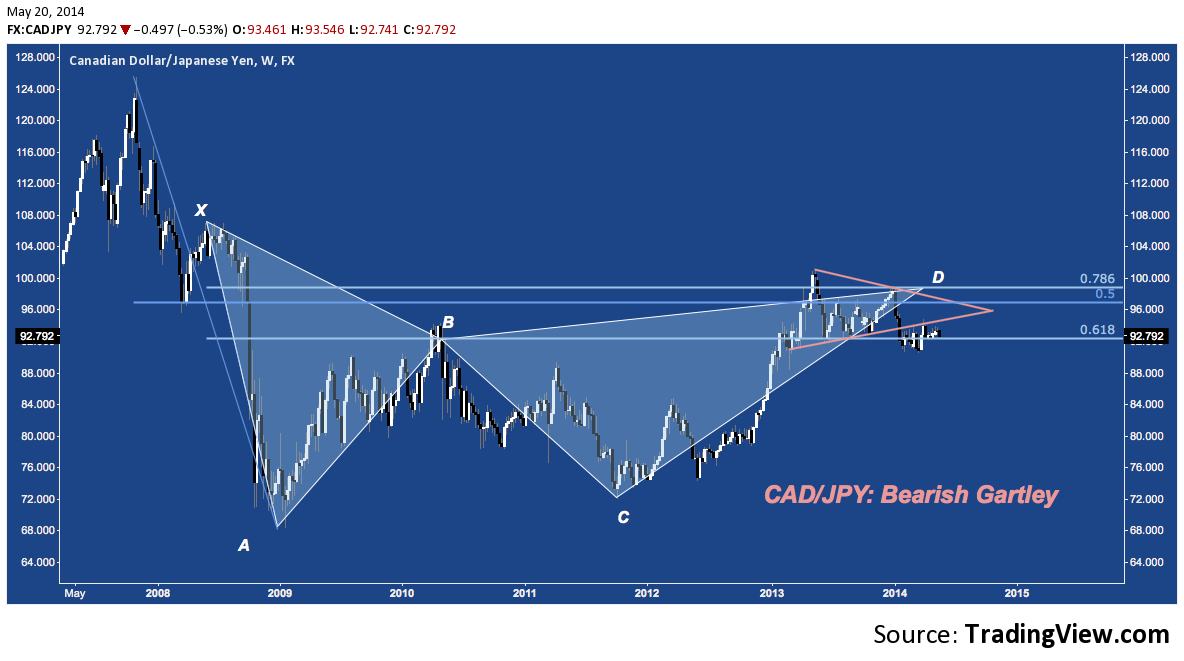
CAD/JPY: Symmetrical Triangle Breakdown, Struggling at 6-Year Bearish Gartley Reversal Zone
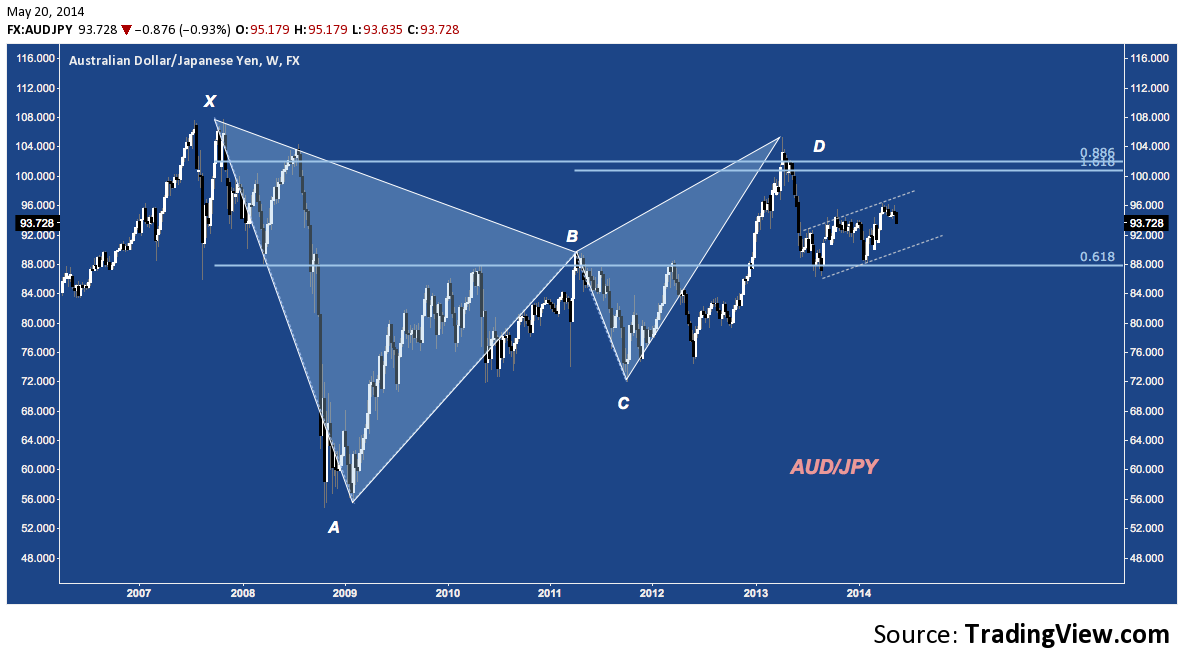
AUD/JPY: Breakdown from 6-Year Harmonic 5-Point Pattern at D, In Bear Flag
And there’s USD/JPY, which we’ll look at a bit more closely.
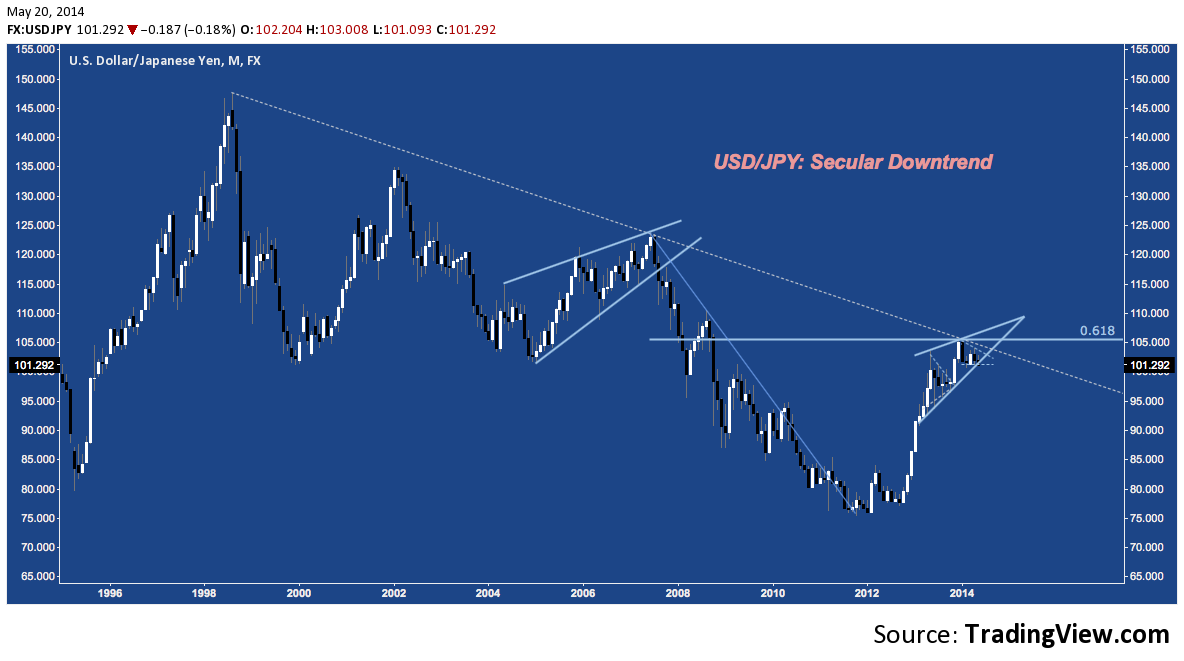
The Big Picture:
USD/JPY: Rising Wedge At Secular Falling Trend Line Resistance, 61.8% Retracement of 2007’s High
The last year:
USD/JPY: Rising Wedge with 2014 YTD Descending Triangle – Breaking This Week 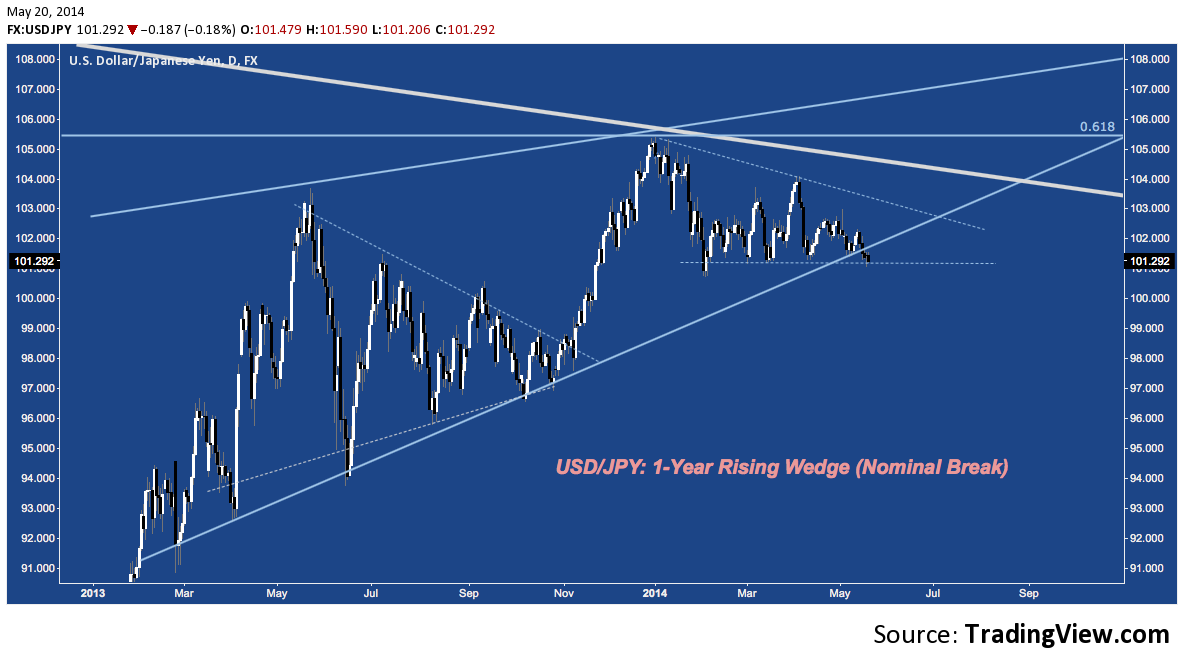
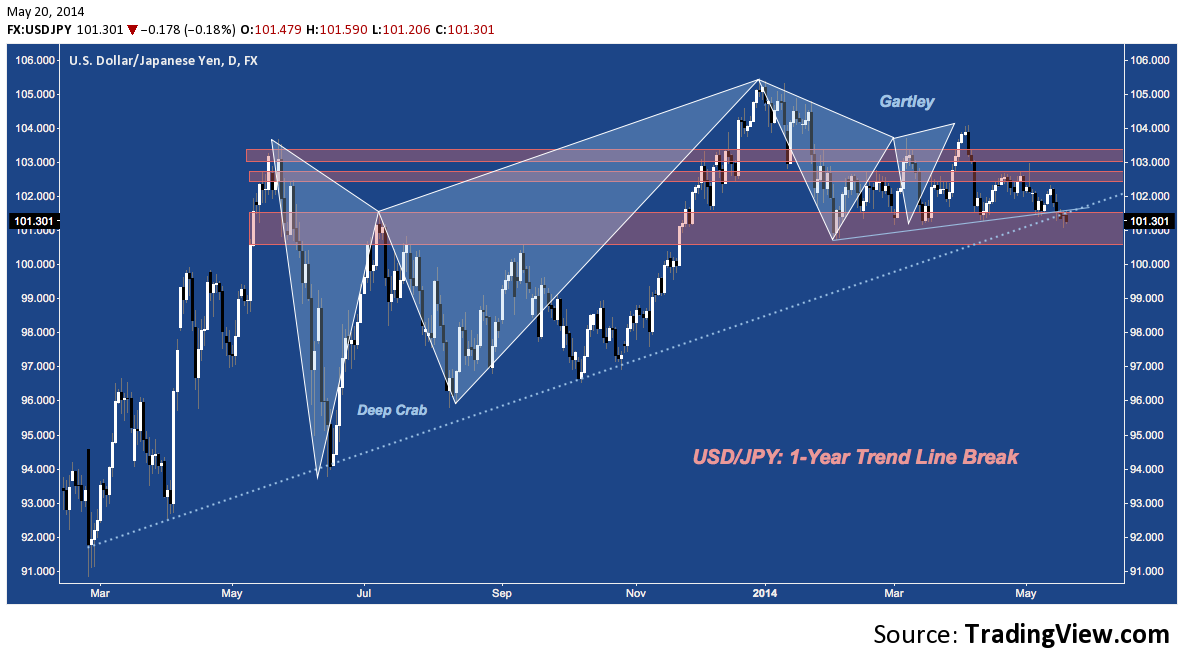
The Last Year Through the Harmonic Lens:
USD/JPY: Trend Line Break, At Q1’s Bearish Gartley Pattern Support
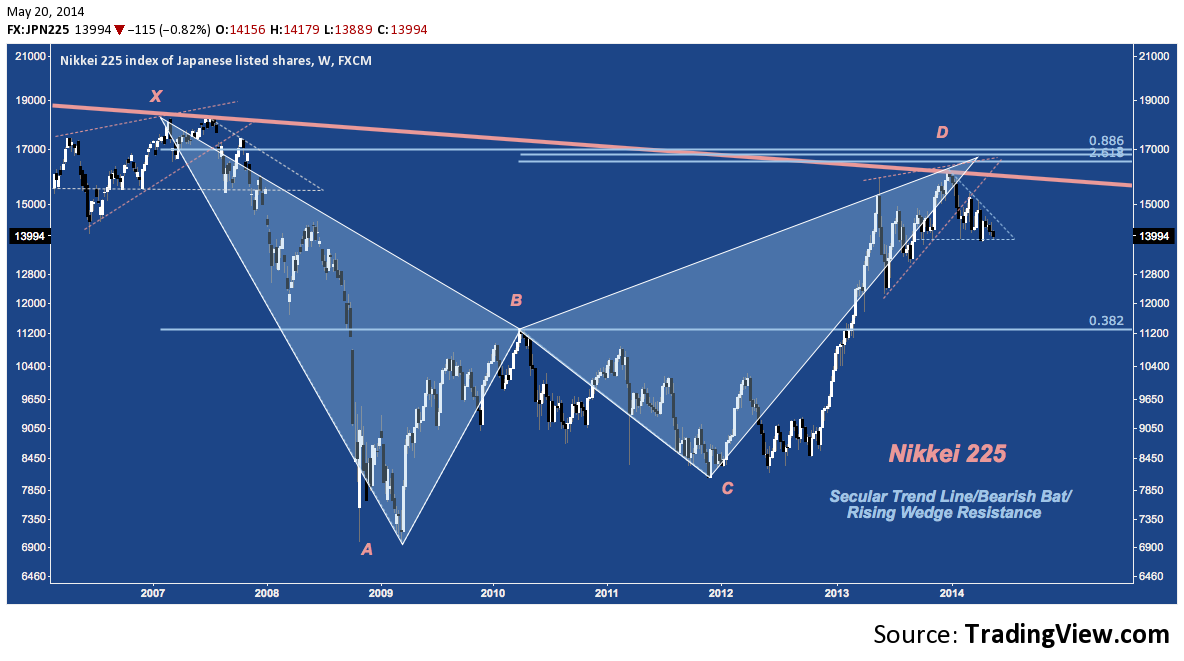
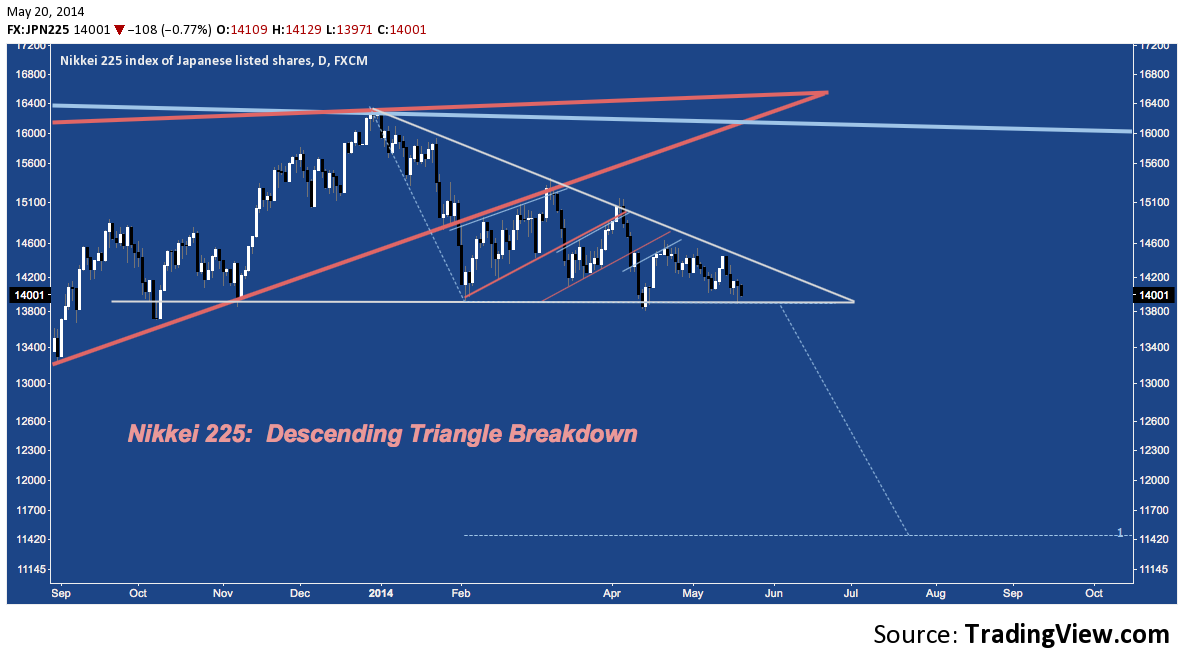
And how about stocks, here’s the big picture on the Nikkei 225. In case you’re unfamiliar, you can see the epic rip from November 2012 (when Japanese parliamentary elections were called, all but guaranteeing Prime Minister Abe’s accession and implementation of the LDP’s proposed economic reforms) to May 2013, and then resumption of the ramp into December 2013. This last push higher brought the NKY into contact with it’s 7-year Bearish Bat potential reversal zone (at D), coinciding with secular trend line resistance. Overall, 2013’s higher lows and higher highs produced a rising wedge (dashed orange lines) – ominous in its similarity to 2006-2007’s (back at X). You can see the descending triangle (more on this below) that has formed in 2014 YTD here:
Nikkei 225 (NKY): Bearish Bat and Secular Trend Line Resistance
Nikkei 225 (NKY): Descending Triangle – At Support
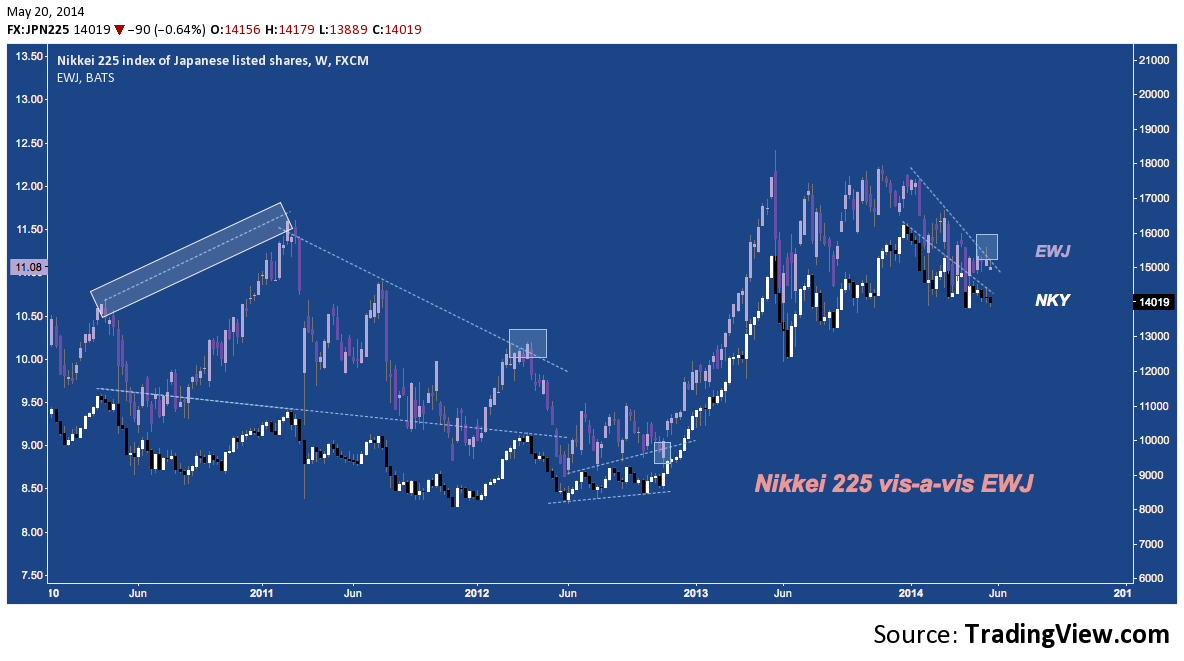
As an aside, most investors outside of Japan itself looking for non-futures exposure to Japanese equities gravitate toward the iShares MSCI Japan ETF (EWJ). While the Nikkei isn’t its explicit benchmark, as the de facto index for Japanese stocks, it’s important to note there are some glaring discrepancies between the Nikkei itself and EWJ. As it happens, where divergences between the two instruments tend to resolve in the Nikkei’s favor:
Nikkei 225 (NKY) v. EWJ: Not So Fast There.
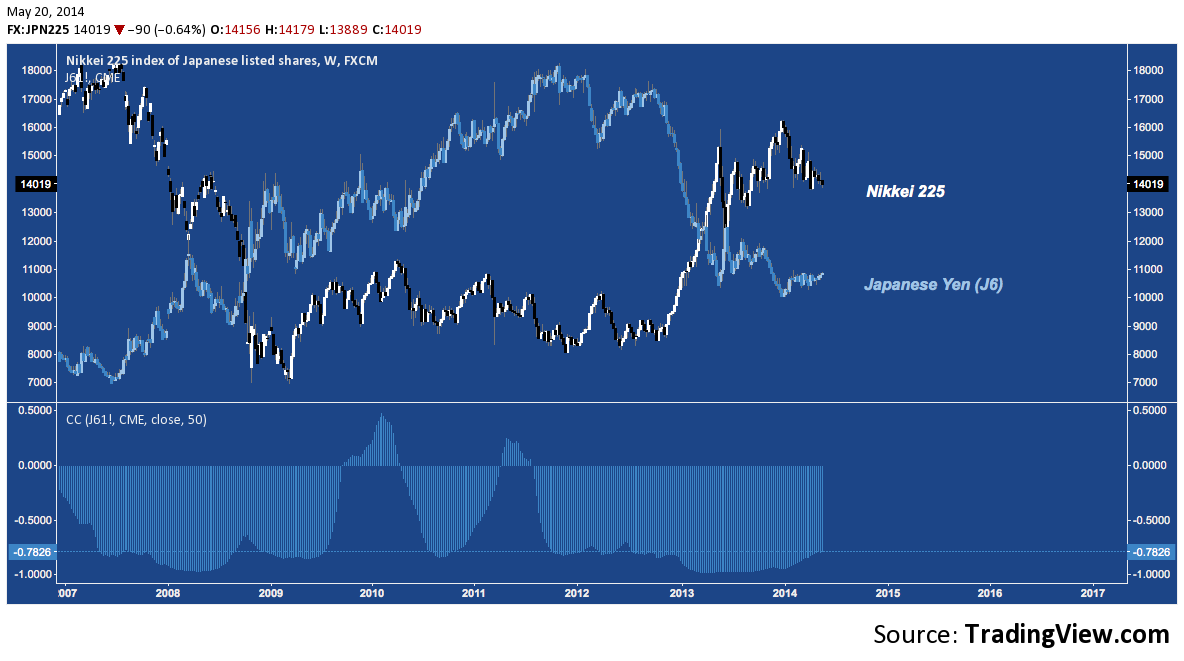
If you thought the last 7 years of USD/JPY and the Nikkei looked similar, that’s because they have been (very). Check out the inverse relationship between the Nikkei and the CME’s Japanese Yen futures contract, J6:
Nikkei 225 (NKY) v. Japanese Yen (JPY): Tight Inverse Correlation
There’s research aplenty regarding whether currency flows and balance of payments have a causal impact and/or leading correlation to a country’s equities. The topic is beyond the scope here, but Japanese markets are a case in-point for study if this macro/inter-market theme interests you.
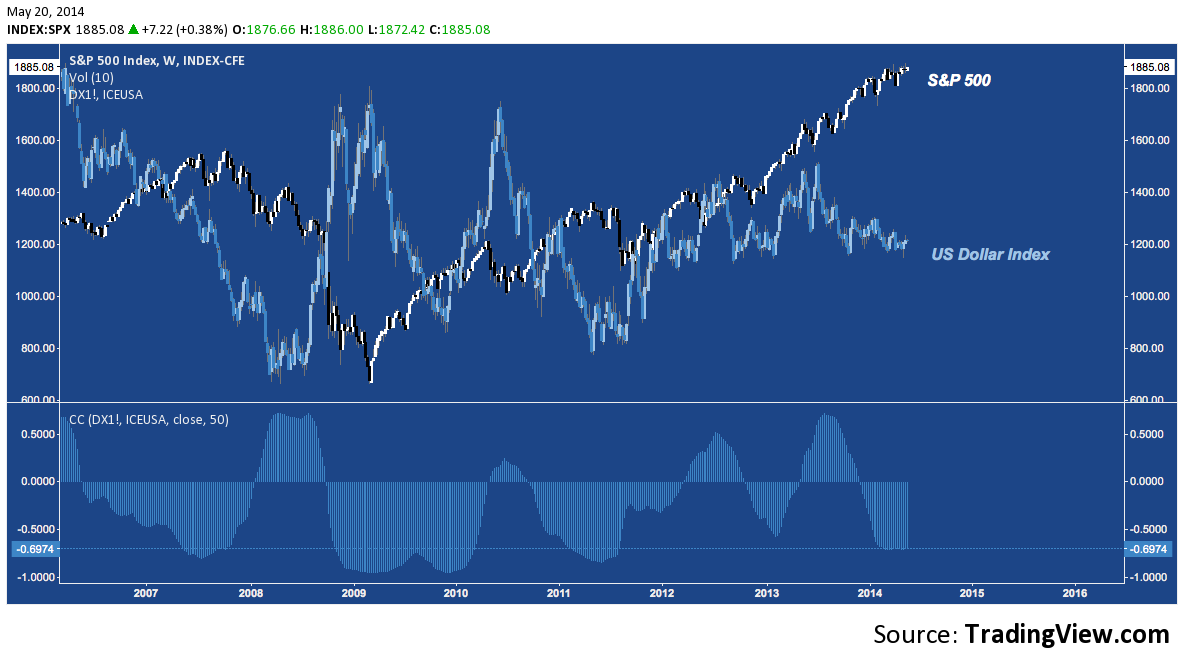
But don’t all stock indices and their “native” currencies have a very clear inverse relationship? Nothing is so simple in a globalist paradigm. As a point of comparison, check out the correlation of the S&P 500 (SPX) with the US Dollar Index (DX), which is a weighted basket of the USD’s exchange rates against 6 trading partners (with 56% being the Euro). The reasons are almost irretrievably complex, but the relationship is far more dynamic. The upshot here? In the case of the Japanese markets, it pays to monitor the inter-market relationship between the Yen and Nikkei with special care.
S&P 500 (SPX) v. US Dollar Index (DX)
Overall, the combination of the JPY strength and Nikkei weakness are a basis for caution. Last year, Japan’s stock market and it’s radically devaluated currency were the vanguard of the indomitable risk-on environment developed markets enjoyed – all of which ended just as equity markets began to stagnate. After their latest moment in the spotlight, Japanese stocks may now be sloughing back into relative obscurity again (at least until the BoJ issues a new round of QE) with interest and flows rotating away.
But with the JPY as an ongoing risk proxy and its stocks still sitting atop massive gains over the past 18 months, now is the wrong time to discount Japan’s relevance. Any further deterioration in the critical technical positioning of these key markets heightens the likelihood of broader risk-off environment taking hold.
Trade ’em well.
Twitter: @andrewunknown and @seeitmarket
Author holds no exposure to securities mentioned at the time of publication. Commentary provided is for educational purposes only and in no way constitutes trading or investment advice.
Any opinions expressed herein are solely those of the author, and do not in any way represent the views or opinions of any other person or entity.


