After Gold prices fell below $1200 per ounce, it seems like many investors have begun to tune out the yellow metal. But since the start of the New Year, Gold has risen almost $30 and is now back above $1200. Could this price action be signaling a January Gold rally?
The one hour chart of Gold outlines a potentially huge pivot shift in supply & demand that savvy traders may be able to take advantage of (provided, of course, they manage risk accordingly with stops).
Gold Prices – 1 Hour Chart
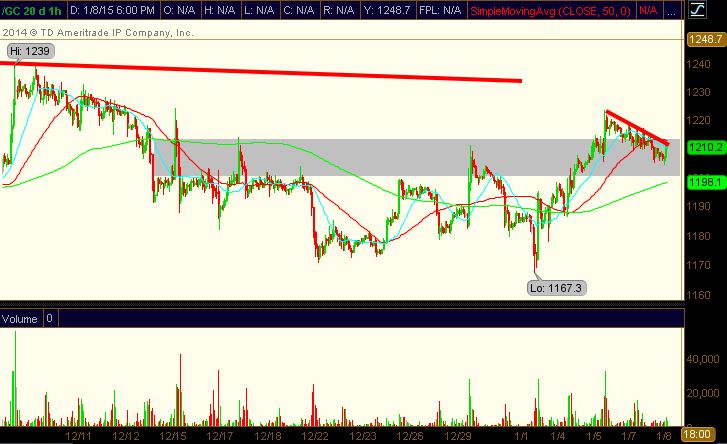
As you can see from the chart above, the $1200-$1220 area has been a significant resistance zone for the past several weeks. After a failed attempt to break lower on New Year’s Day, we’ve seen a solid rally back above $1200.
There is still some resistance to work through, but if Gold can continue to hold over $1198 or so, then we’ve likely seen an important shift.
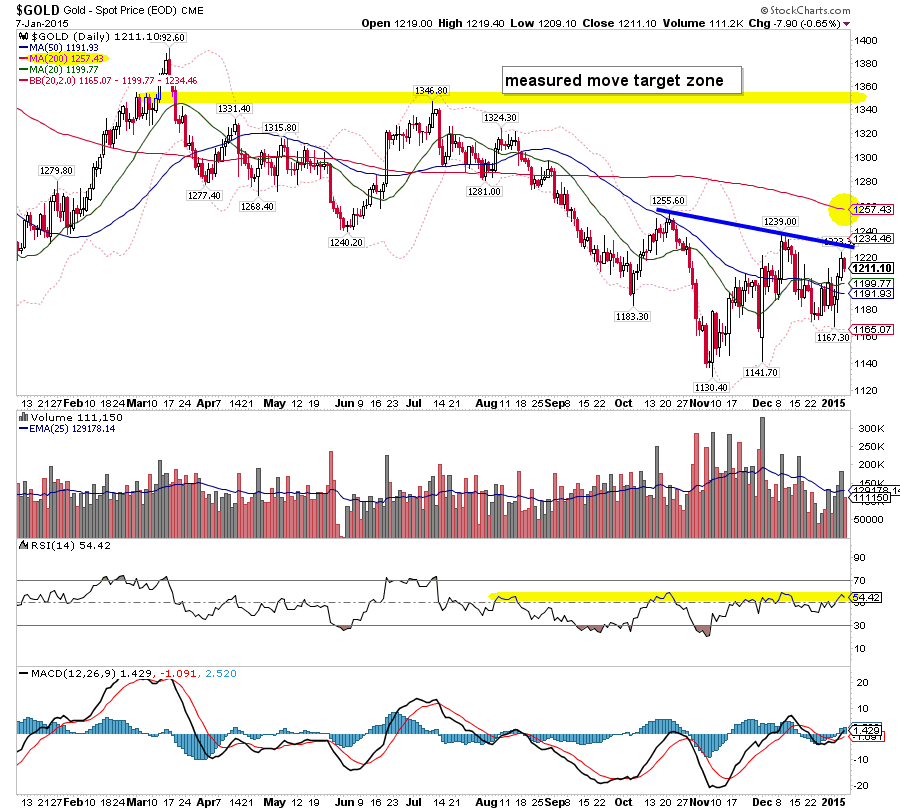
Looking at the daily chart below, near-term resistance shows up at the downtrend line around $1230. There is also a potential head and shoulders bottom pattern that measures to about $1350 with a move over the $1230 neckline. Any move above this level would likely bolster any January Gold rally.
Gold Prices – Daily Chart
A couple of other points to note:
- The 200 day moving average is fairly close by in the $1250’s. It’s safe to assume sellers would show up there if we get there.
- RSI has been unable to crack the mid 50’s levels for some time now.
- This area gives new longs a low risk reference point to trade against.
Thanks for reading!
Follow Aaron on Twitter: @ATMcharts
Author has a trading position in ultra long gold ETF (UGL) at the time of publication. Any opinions expressed herein are solely those of the author, and do not in any way represent the views or opinions of any other person or entity.


