 If you are confused by the elated response to the Fed’s decision not to taper, rest assured: you’re not alone.
Following yesterday’s “No Taper” pseudo-surprise and the FOMC’s dovish “wait-and-see” policy retrenchment, equity markets (developed and emerging) continued their rally into all-time highs.
Weren’t we just getting past the “bad news is good news” feedback loop whereby soft economic data skewed bullish because it reinforced the Fed’s accommodative stance and thus support for asset prices (e.g. stocks)? Wasn’t a rational discounting mechanism about to reassert itself and the phrase “Don’t fight the Fed” finally put to bed; at least until the next crisis?
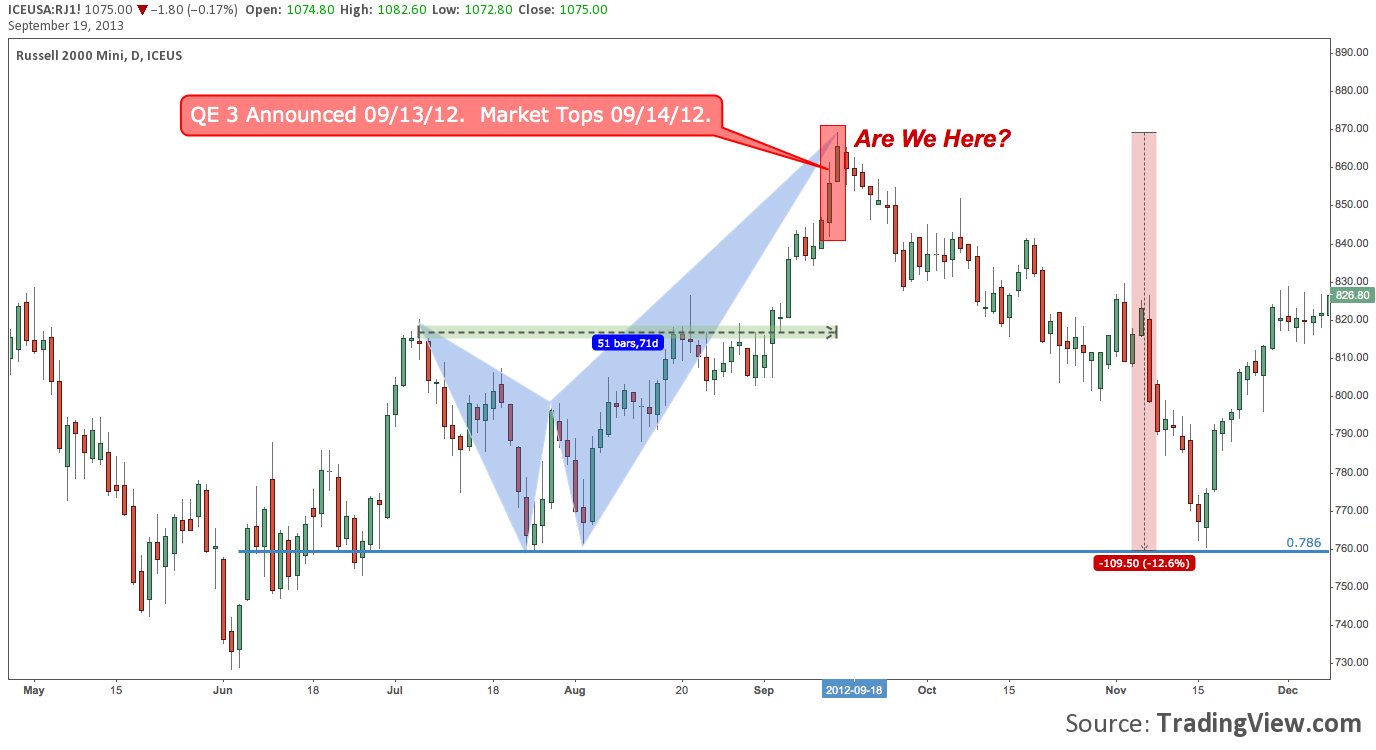
This is not unlike last year, where the FOMC introduced “QE3” in its 09/13/12 policy statement. In what had become characteristic “bad is good, but worse is even better” fashion, stocks rallied aggressively that day as the Fed not only reaffirmed but yet further enhanced its stimulus efforts to assist a still-anemic economic recovery.
And then, as if coming to their collective senses: stocks topped the next day. Perhaps the most widely-shared market memory of this period may be $705.07 top-tick on Apple (AAPL) that followed a few market days later.
Russell 2000 Futures (TF) – September-November 2012 – Daily: Short-Lived QE3 Jubilation
Compare that period to the one leading into yesterday’s Fed decision, 9 FOMCs and almost exactly 1 year later. Is the FOMC’s decision to delay tapering because the requisite economic tailwind strength isn’t there really such a good thing? Is the mounting confusion over the Fed’s policy intentions due to its ironic, fumbling attempts at transparent forward guidance something to celebrate?
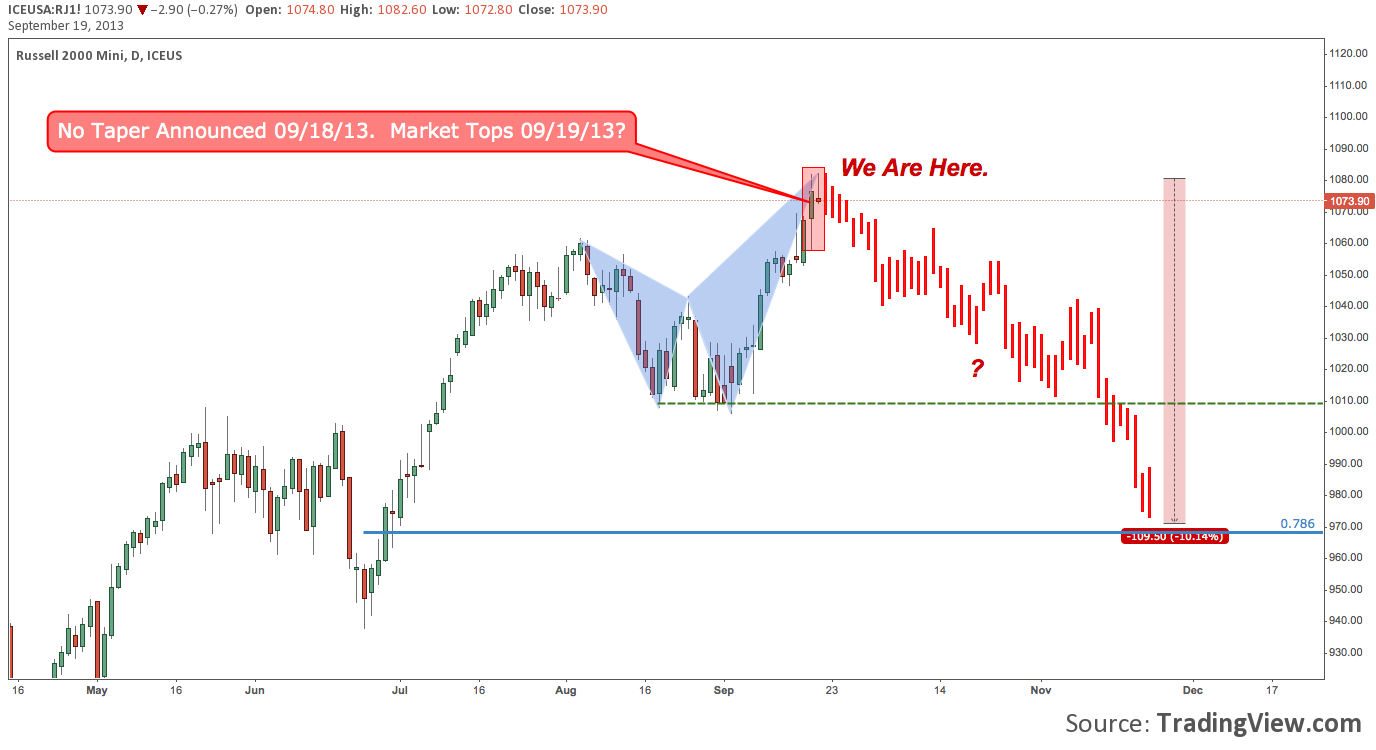
If equity markets do reconsider yesterday’s initially bullish reception – as they did in September 2012 – what follows may track very closely to Fall 2012:
Russell 2000 Futures (TF) – September 2013 – Daily: Setting Up a 2012 Repeat?
2012’s pullback found support at the lows of its pre-FOMC harmonic pattern (blue), coinciding with the 78.6% fibonacci retracement of the June Low to September high.
What could that mean for this year? The pre-FOMC pattern low comes in at 1010 – coincident with the May 22nd then-all-time high installed at 1008.4. The 78.6% fibonacci retracement of the June low to September high here comes in near 970. Pulling back this far would break the Russell 2000’s rising channel, broaching the question of a much deeper pullback.
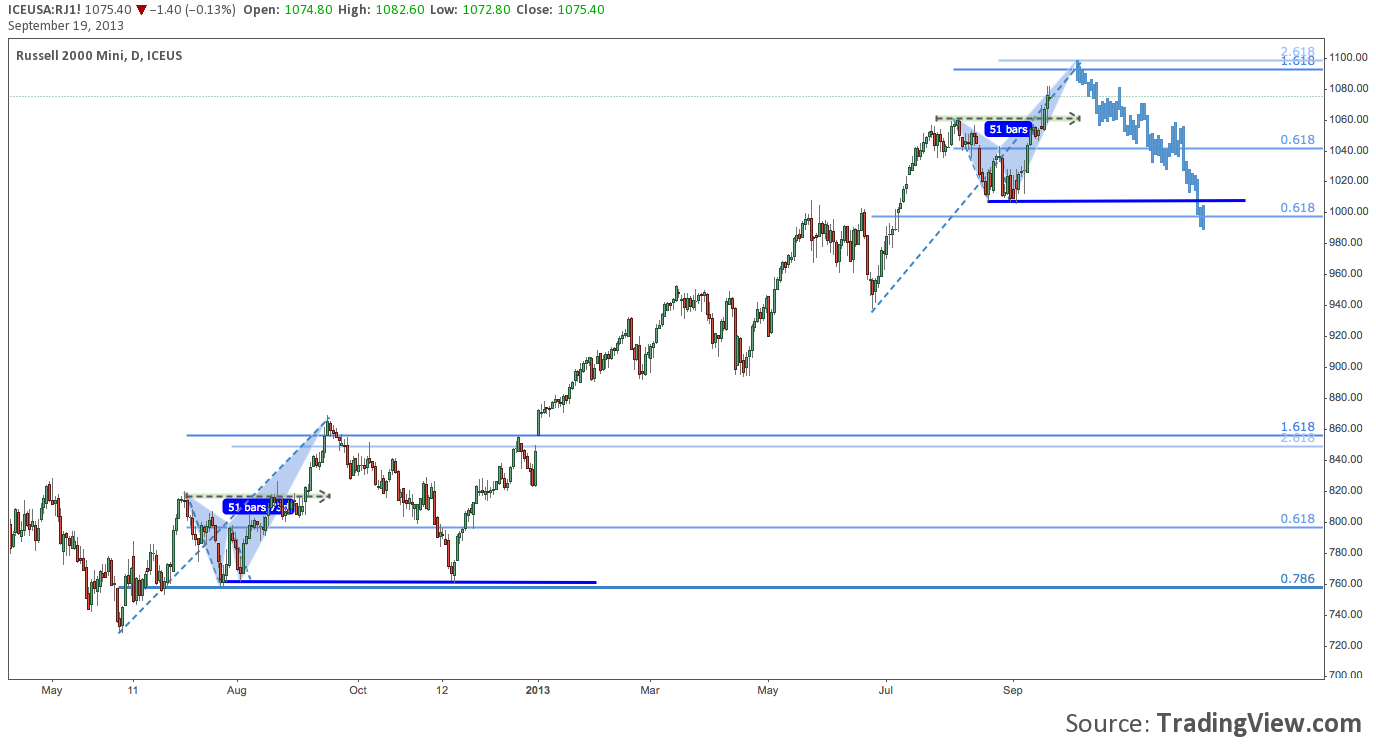
Zooming out, here’s the 2012 and possible 2012 analogs in wider context, here with a slightly variant move into early October toward 1100 before turning lower:
Russell 2000 Futures (TF) – September 2012-September 2013 – Daily: Is a Market Pullback Next?
Twitter: @andrewunknown and @seeitmarket
Author holds no positions in instruments mentioned at the time of publication.
Any opinions expressed herein are solely those of the author, and do not in any way represent the views or opinions of any other person or entity.


