I’ve had a great response to my Dow Award paper, Forecasting a Volatility Tsunami, with it being downloaded over 3,000 times since April. I really appreciate the support and the positive feedback I’ve received so far.
Last week I had the opportunity to do a webcast with the Market Technicians Association, going into much greater detail about the importance of risk management and shedding some more light on the topic of the paper – low levels of dispersion within the VIX.
Here’s What I’m seeing today
As of June 16th (last Friday), the dispersion within the Volatility Index (INDEXCBOE:VIX) (i.e. a measure of daily gyrations in price) has fallen below the threshold I highlighted in my paper.
As I mentioned in my webcast and in the paper itself, I do not believe this ‘trigger’ alone is enough to generate a final conclusion on the potential direction of the VIX and that in my own research I combine it with several other pieces of data. For example, low levels of dispersion in the Volatility Index act as signs of clouds forming in the sky and a sign that it could potentially rain (or the VIX could potentially spike higher) but it’s not a guarantee…as nothing ever is. Just like being able to have dark clouds in the sky without rain, we’ve had periods of time where dispersion has been low for the VIX without it being followed by a spike higher.
While last Friday sent the standard deviation for the VIX Volatility Index to a very low-level, paired with some over factors I follow, sent up a yellow flag for volatility in my opinion.
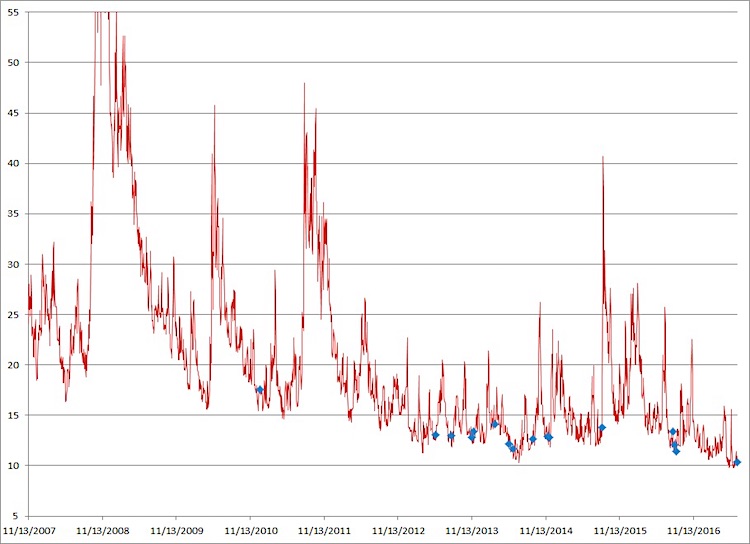
Below is a chart of the VIX close with previous instances of what I’m seeing taking place right now. Since 2012 we’ve seen this type of trigger occur before several intermediate and large swings within the VIX as well as at the end of 2010. Most recently we saw three instances in August of last year before the Volatility Index rose over 70% and major U.S. indices weakened for several weeks.
Seasonality
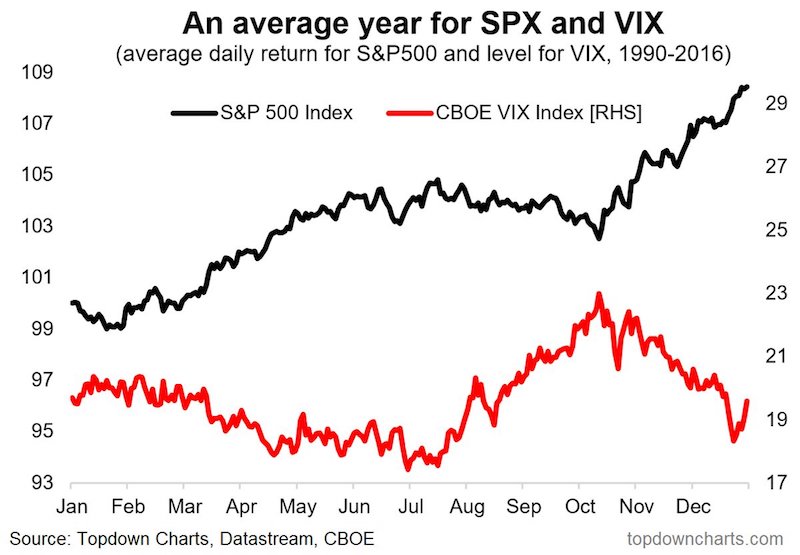
I find it extremely interesting that this is occurring near the end of June, as based on seasonality, that has been when the Volatility Index has historically bottomed out. Thanks to Callum Thomas for the below chart, which he included in his weekly ‘chart storm’ over the weekend, showing the seasonal patterns for the S&P 500 (INDEXSP:.INX) and the VIX Index since 1990.
This post is not meant to act as a recommendation to buy or sell securities but to show an example of how I have incorporated volatility dispersion within my own research. We’ll see what the VIX does in the coming weeks.
Thanks for reading.
Disclaimer: Do not construe anything written in this post or this blog in its entirety as a recommendation, research, or an offer to buy or sell any securities. Everything in this post is meant for educational and entertainment purposes only. I or my affiliates may hold positions in securities mentioned in the blog. Please see my Disclosure page for full disclaimer. Connect with Andrew on Google+, Twitter, and StockTwits.
Twitter: @AndrewThrasher
Any opinions expressed herein are solely those of the author, and do not in any way represent the views or opinions of any other person or entity.


