The U.S. Dollar continues to be the most powerful currency in the world. And for this reason, it’s also the most watched.
When the dollar is on the move, it can have an effect on the various asset classes.
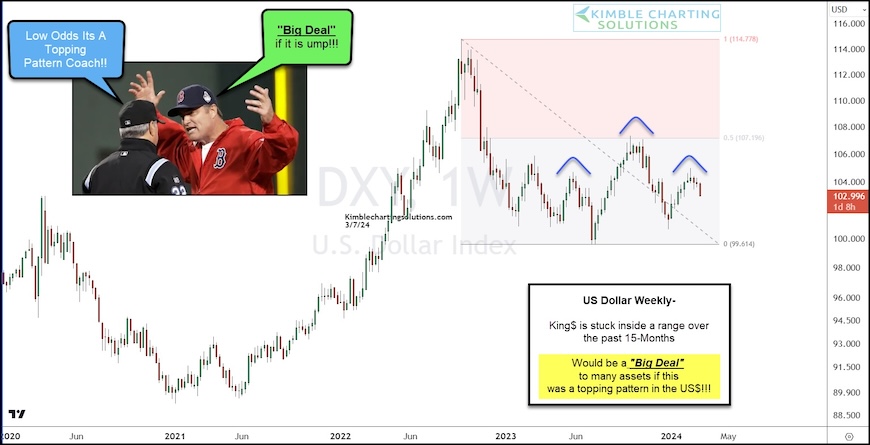
Today we look at a “weekly” chart of the old King Dollar. And as you can see, the dollar has been stuck in a trading range the past 15-months.
During this time, the dollar topped out at the 50% Fibonacci retracement. Looking closer, is it possible that this top is the “head” of a bearish head and shoulders pattern?
Let’s just say that the odds are low that this is a head and shoulders topping pattern.
But it would be a really BIG DEAL if it is. So stay tuned!
U.S. Dollar Index “weekly” Chart
Note that KimbleCharting is offering a 2 week Free trial to See It Market readers. Just send me an email to services@kimblechartingsolutions.com for details to get set up.
Twitter: @KimbleCharting
The author may have a position in mentioned securities. Any opinions expressed herein are solely those of the author, and do not in any way represent the views or opinions of any other person or entity.


