To get a quick overview of the markets direction, let’s look at the key stock market ETFs that make up Mish’s Economic Modern Family.
Also, if you haven’t picked up Mish’s 2022 Yearly Outlook, here is a full report that not only shows an in-depth view of the market but also gives our big picks and trends to watch through the new year.
With that said, let’s take a short-term look through the daily charts of the MF to see which key sectors are leading the way or falling behind.
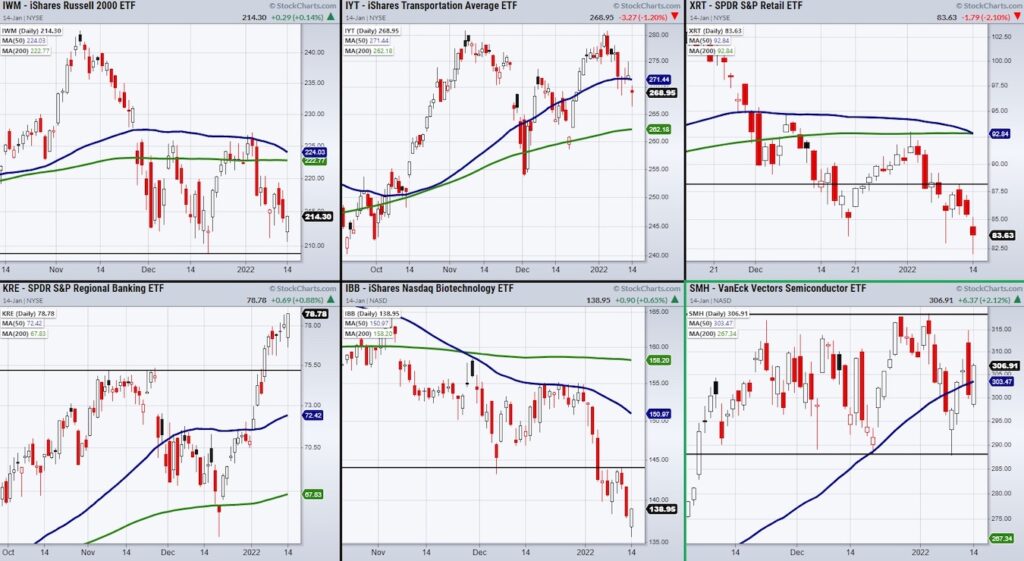
The first member is the small-cap stock index Russell 2000 ETF (IWM).
Although IWM has been choppy, it is still holding over major support at $208 showing a neutral stance.
Watch for IWM to head back toward the middle of its range near $225 before it hits resistance.
Moving to our weakest members, the Retail ETF (XRT) and Biotech ETF (IBB) sectors continued to trend lower and are grasping to find support. Currently, both are in a bearish phase with the 50-Day moving average under the 200-DMA. Watch for XRT to trade over $88.17 and for IBB to clear $144.07 before these can make a comeback.
On the other hand, the outperforming members are the Semiconductors ETF (SMH) and Regional Banking ETF (KRE). If banking companies continues to report well, watch for KRE to hold support at the $75.60 area. However, before SMH can make any meaningful progress, it will need to clear its mini range from $287-318.
The last sector is the Transportation ETF (IYT).
Sitting between its 50 and 200 DMA, IYT could be showing us that the movement of goods is slowing down or stagnating. If people are expecting the 2022 stock market to push higher, IYT will need to keep its upward momentum instead of drifting sideways.
Currently, we are seeing a possible split in Modern Family as few are attempting to push to new highs while most are getting stuck in sideways price action like IWM.
Even with small breakouts to new highs, if prices revert to their average trading zones, we could be in for a very choppy year. Therefore, watch for trades near the bottom of ranges and remember to quickly get out if the range low is broken.
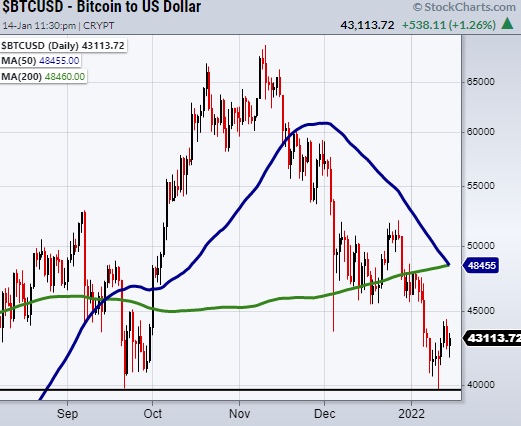
The last member is Bitcoin which is currently holding over major support from roughly 40k.
While it has trended lower with the general stock market, it will be interesting to see if BTC can change directions.
If not, like the other Family members, it could fall into a rangebound trap.
Stock Market ETFs Trading Analysis & Summary:
S&P 500 (SPY) 456.60 is price support
Russell 2000 (IWM) 208.76 is price support
Dow Jones Industrials (DIA) needs to hold over the 50-DMA at 358.50
Nasdaq (QQQ) 369.44 is price support
KRE (Regional Banks) 75.76 is price support
SMH (Semiconductors) Stuck in the middle of its range with 318.82 to clear
IYT (Transportation) 263 next price support area
IBB (Biotechnology) Needs to clear 144.07
XRT (Retail) 88.17 to clear
Twitter: @marketminute
The author may have a position in mentioned securities at the time of publication. Any opinions expressed herein are solely those of the author and do not represent the views or opinions of any other person or entity.
 Rolling Over At Key Fibonacci Level?")


 Rolling Over At Key Fibonacci Level?")
