As the 12 year bull market rages on, the importance of technology stocks has taken center stage… in our daily lives as well as in the stock market.
Make no mistake, this bull market has been lead higher by technology stocks. And since the beginning of the COVID-19 pandemic, that leadership has morphed into rocket-fuel.
So much so that market participants need to be concerned about tech overheating here.
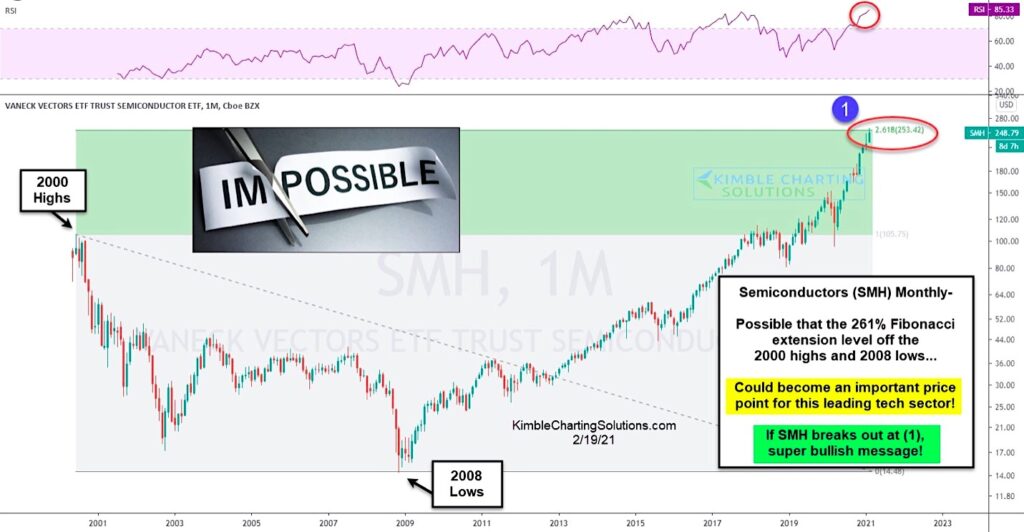
Take today’s chart for example: a long-term “monthly” chart of the VanEck Vectors Semiconductor ETF (SMH). Within the tech world, semiconductors have been a leading sector.
But they are “running” hot into an important fibonacci price level at (1). This level represents the 261.8 Fibonacci extension using the 2000 highs and 2008 lows. As well, momentum is near 20-year highs.
Is SMH overheating and set to stall out? Or is a big breakout coming? What happens here is important. Stay tuned!
Semiconductor ETF (SMH) Long-Term “monthly” Chart
Note that KimbleCharting is offering a 2 week Free trial to See It Market readers. Just send me an email to services@kimblechartingsolutions.com for details to get set up.
Twitter: @KimbleCharting
Any opinions expressed herein are solely those of the author, and do not in any way represent the views or opinions of any other person or entity.


