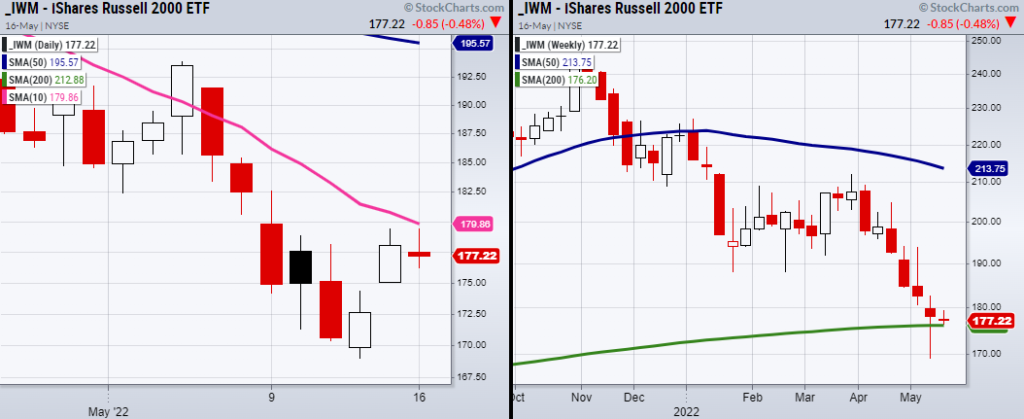
The small-cap index Russell 2000 (IWM) tested it’s past Friday high Monday at $179.41 but ultimately could not hold.
Just above this price level stands the 10-Day moving average at $179.86.
This will be the next pivotal area for IWM to clear if we are going to see a continued rally from last Thursday’s low.
When looking for support, IWM tested and held over its 200-Week moving average at $176.20.
Both of these moving averages sandwich IWM into an interesting price area to watch in Tuesday’s trading session.
Next, we should look for confirmation of IWMs next move by watching two important symbols.
The first is the 20+ year treasury bonds (TLT) and the second is High yield corporate debt (JNK).
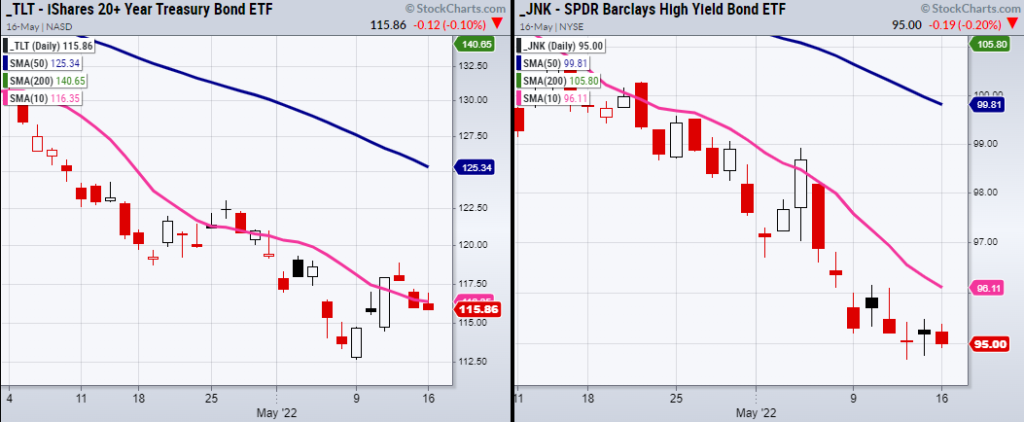
Both can help us decide which direction the overall market is leaning towards.
For instance, the TLT can show upside market pressure if it’s unable to clear and hold over its 10-DMA.
On the other hand, if JNK begins to pick up the pace and pushes towards its 10-DMA at 96.11 that would be a positive sign for the market since it would show that investors/traders are willing to buy high-risk debt.
However, because JNK looks weak and hasn’t given any upside indication, we should stay cautious of buying equities right now.
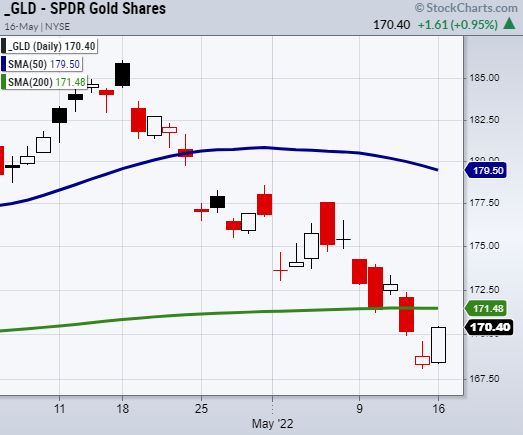
Having said that, one symbol we are currently watching is gold ETF (GLD).
As a safety play, GLD is interesting as it’s looking to clear back over its 200-DMA at $171.48.
Stock Market ETFs Trading Analysis and Summary:
S&P 500 (SPY) 410 resistance.
Russell 2000 (IWM) needs to clear the 10-DMA at 179.86
Dow (DIA) 322 needs to hold. 325.67 to clear.
Nasdaq (QQQ) Inside day. 309-317 resistance area.
KRE (Regional Banks) Minor support 58.75
SMH (Semiconductors) Inside day.
IYT (Transportation) 235-239 resistance.
IBB (Biotechnology) 115-118 resistance area.
XRT (Retail) 70 resistance.
Twitter: @marketminute
The author may have a position in mentioned securities at the time of publication. Any opinions expressed herein are solely those of the author and do not represent the views or opinions of any other person or entity.

 Rolling Over At Key Fibonacci Level?")


