Key Stock Market Takeaways:
– Strength that fails to overcome weakness can lack follow through
– Evidence suggests bear market has run its course
– Additional breadth thrusts can fuel further gains
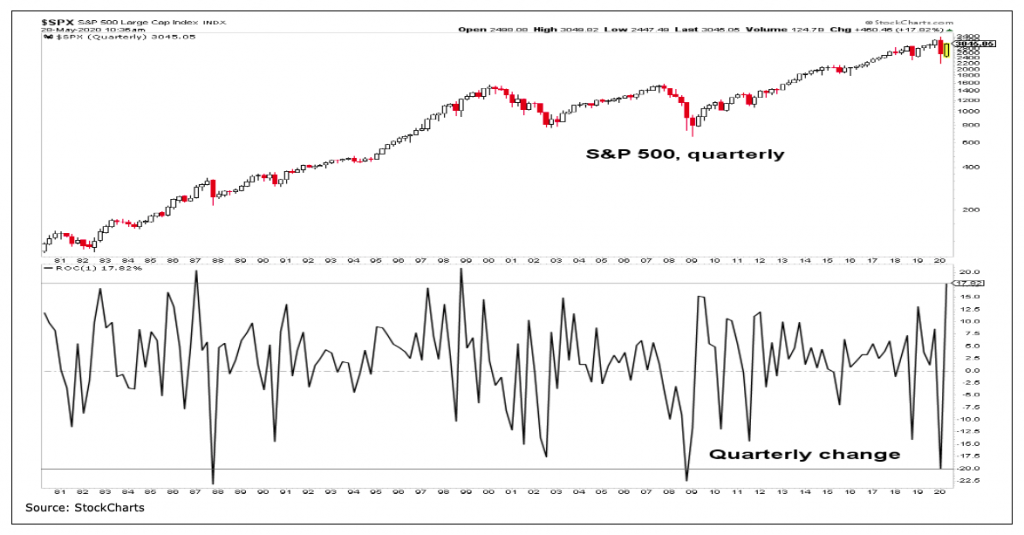
After experiencing its largest quarterly decline in over a decade in the first quarter of 2020, the S&P 500 Index INDEXSP: .INX is on pace to book its best quarterly gain in over two decades. It is not uncommon for the “best since” and the “worst since” to occur in close proximity.
Volatility leads to volatility.
The largest single-day gains and the largest single-day loses have tended to occur within bear markets. In other words, there are times when remarkable strength is primarily a function of the remarkable weakness that preceded it. In these cases, strength ebbs and weakness re-emerges. We might label these instances “bear market rallies.”
Other times, however, remarkable strength leads to persistent strength as so-called “breadth thrusts” emerge.
Discerning between these two regimes is not always clear-cut in real-time. The rally in the S&P 500 off its March lows has been one for record books (more on this in a moment) and what started as an uncomfortably narrow move has in recent weeks attracted increasingly broad participation. This allowed us to upgrade our view of breadth, which shifted the overall weight of the evidence into positive territory.
We now have 94% of S&P 500 stocks trading above their 50-day averages (90% is the threshold for a breadth thrust), while on the mid-cap S&P 400 it stands at 97%. The overall number for the NASDAQ is just below 90%, which is one of the best readings in over 40 years worth of data.
As strong (and as broad) as the recent market moves have been, that they are coming in the immediate wake of pronounced weakness is a reason for some pause. The S&P 500 recently recorded its second best 40-day gain ever. Similar episodes in the past have tended to overcome the weakness that preceded the 40-day rally and produce sustained follow through.
The historical exception to this was 2001 – the rally did not overcome initial weakness and reversed course after near-term momentum faded. The 2020 story has yet to be written, but the 2001 path seems uncomfortably familiar.
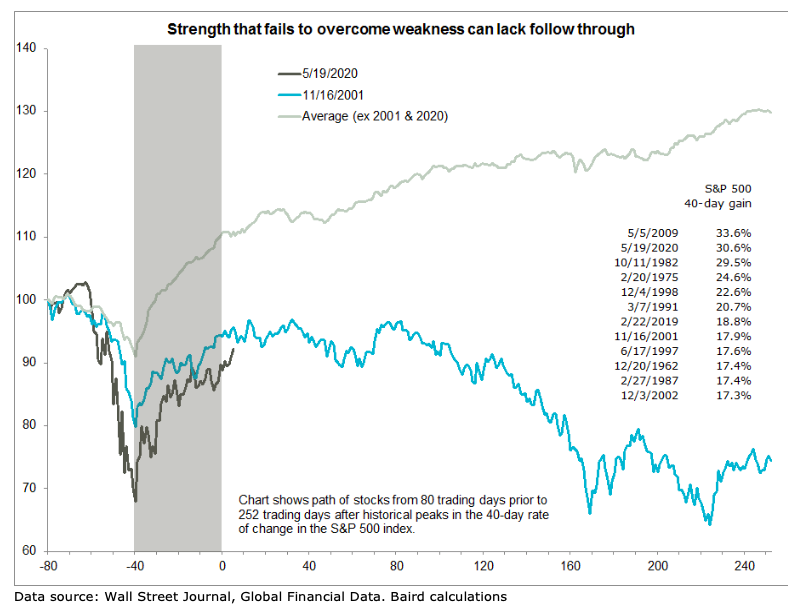
In retrospect, 2001 was a bear market rally that faded. There is a risk that 2020 will turn out in a similar fashion. But that risk is diminishing. If the S&P 500 rally off of the March lows has been a bear market rally, it would be the largest of that kind in history. Moreover, Ned Davis Research (which has a more robust definition of such things than is usually found in the media) has concluded that the cyclical bear market that emerged in the first quarter has run its course, and will be recorded as the shortest (though not least severe) bear market in history.
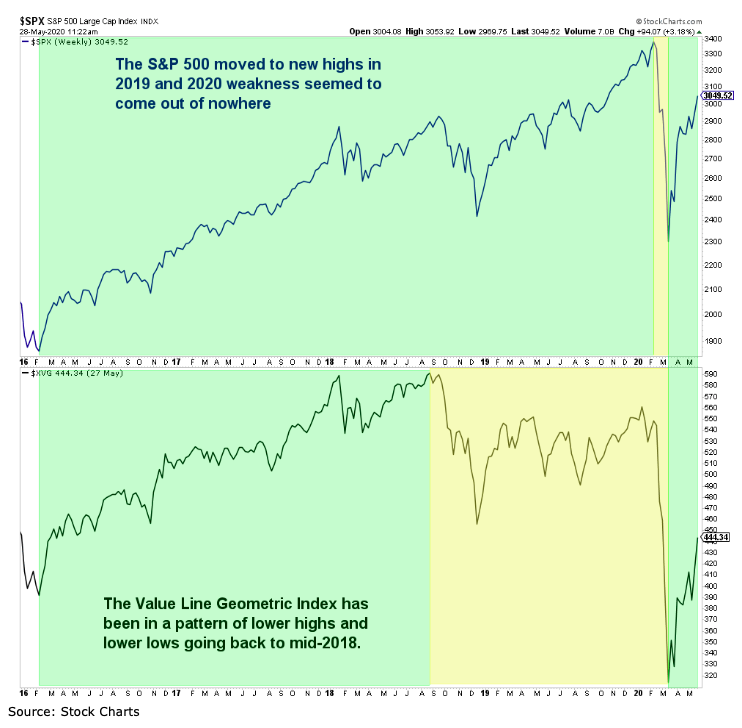
My take is slightly different. Excluding a handful of stocks that have propped up the S&P 500 over the past several years, broader indexes (like the Value Line Geometric Index) have been exhibiting bear market behavior since mid-2018. The March lows represent a more thorough and deep-seated capitulation than what can be seen just by observing the S&P 500.
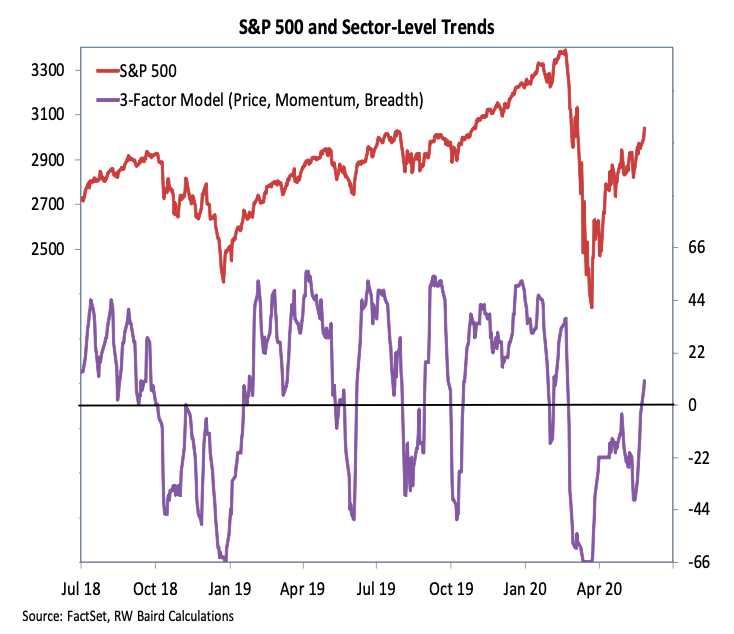
Whether we have seen a low or the low for this cycle remains to be seen (though emerging evidence favors the latter). The sustainability of any move is best determined by looking beneath the surface. Our sector-level trend indicator helps in this regard, by looking at price, momentum and breadth trends at the sector level. The initial improvement seen in April came as momentum trends improved. But that was insufficient to carry this indicator back to positive territory.
More recent gains have been fueled by improving price and breadth trends. Industry group trends have also improved. Of the 75 industry groups we track for the S&P 1500, all are above their 10-week averages, all have 10-week averages that are rising, and half have 40-week averages that are rising.
The counter-point to the evidence of improving breadth is the relative narrowness of the new high list. The number of stocks on the S&P 500 making new 52-week highs has gone from expanding to contracting, though the number of stocks making new 50-day highs has continued to expand.
I continue to keep a close eye on the percentage of stocks making new 20-day highs. It has spiked several times during this rally, but has thus far failed to exceed the 55% threshold that would signal a breadth thrust and add to the accumulation of evidence suggesting a sustainable (though perhaps not unrelenting) cyclical rally has emerged.
Twitter: @WillieDelwiche
Any opinions expressed herein are solely those of the author, and do not in any way represent the views or opinions of any other person or entity.


 Ready To Break Out?")


 Rolling Over At Key Fibonacci Level?")