 With the S&P 500 lingering in a choppy pullback some 3% shy of it’s all-time high at 1709, the argument over stock market complacency and a deeper market correction – at least, in the short-term – is an undecided one.
According to at least one sentiment measure, that is about to change.
A widely-watched metric valued for its timely signals of short-term sentiment extremes, the equity put-call ratio – and put-call ratios, in general – is a basic but effective tool that often features prominently in contrarian equity market analysis.
Last Friday, the weekly equity put-call ratio registered a closing value of 0.5, a low visited only 4 times (and broken only once) since early 2011.
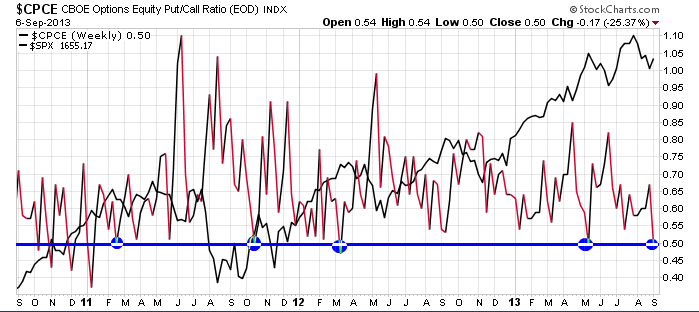
In the context of the back-half of the post-crisis bull market, long call ownership – usually employed to make a bullish directional bet, but also to function as a hedge against adverse upside exposure – outweighs long put ownership by a heavy margin.
The equity put-call ratio is applicable to individual stocks – broad stock index options are covered under their own ratio – is commonly associated with the prevailing mood of retail investors. As a first approximation, then, the preponderance of call ownership would indicate non-professionals – whether rightly or wrongly, the so-called “dumb money” – is highly bullish; and more than a little complacent amidst a market context beset by geopolitical turmoil and major US monetary and fiscal policy headline risk in the coming weeks. A cursory glance at the blue line above suggests the rubber-band of enthusiasm for long equity calls is poised to snap back, with a deeper stock market correction to follow.
Quick glances often fail under market scrutiny, though.
Is the equity put-call ratio consistently effective? What does consistently mean here? And if it is, how effective (i.e. how deep are the negative moves it ostensibly signals) is it?
Study: How Often And Well Does the Equity Put-Call Ratio Signal a Tradeable Pullback?
To answer these questions, I reviewed the equity put-call ratio over the last 36 months (September 2010-September 2013) vis-a-vis the S&P 500’s performance over the same period.
This study is based on two defining criteria:
1) A contrarian sell signal is triggered for the S&P 500 where the weekly equity put-call ratio closes below .55.
and
2) Sell signal periods measure from the S&P 500 closing value coinciding with the signal, to the S&P 500 closing value of the next non-consecutive signal (as described in 1).
The resulting sample space: 21 (22 if the current period is included) historic signal periods, or a new signal every 1.6 months. This contrasts markedly with triggering off a weekly equity put-call ratio below .5, which yields a comparatively modest 7 observations.
The first of two charts below depicts these signals and the periods that followed. Interestingly, you’ll note SPX experienced a positive net change over 16 of 21 periods – 76% of the time. Five periods experienced a negative net change, though two of these were essentially flat.
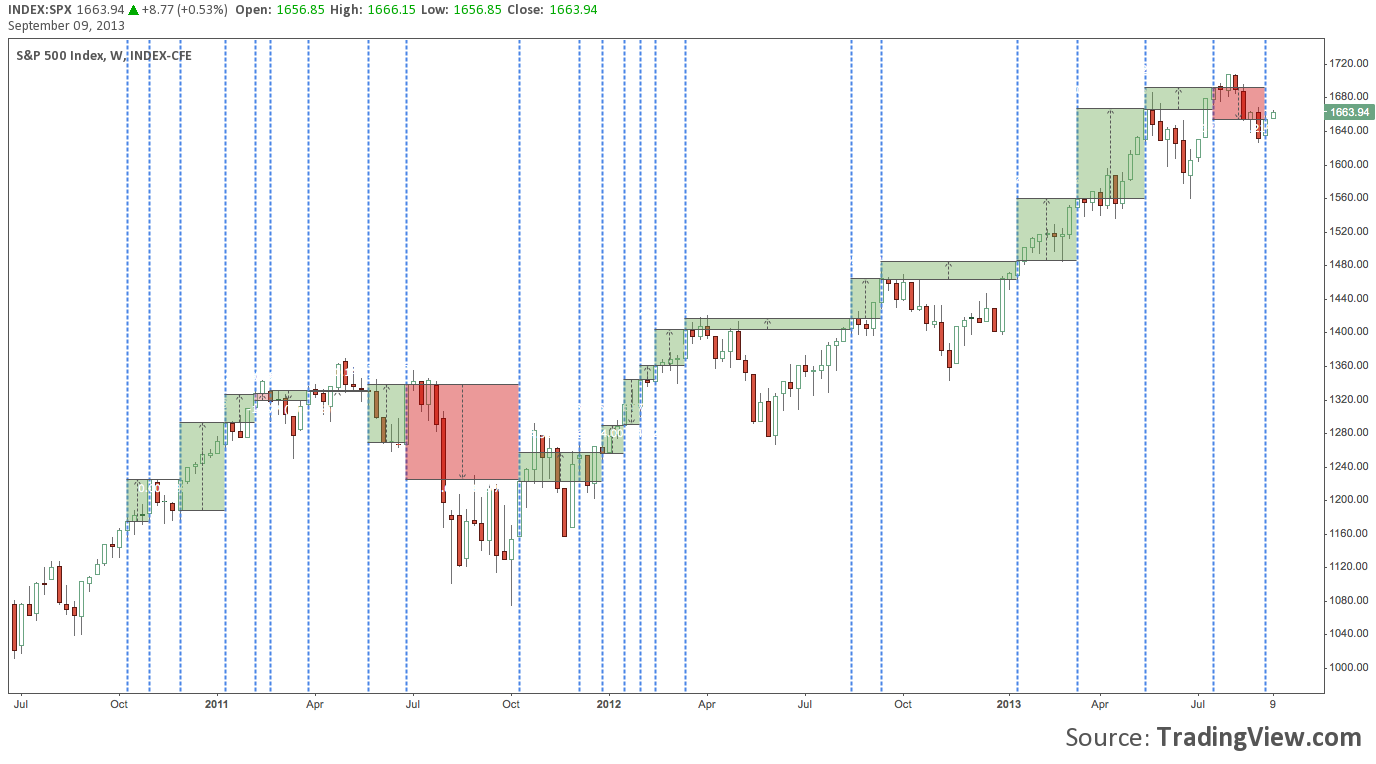
Overall, the overwhelmingly positive net change over the 21 periods observed is a novel affirmation of what a price chart stripped of put-call data already tells us: the primary SPX trend has suffered its share of pullbacks – even a legitimate correction – over the past 3 years; but the trend is unmistakably up.
In short: the overarching trend is to be respected. The 20+ equity put-call sell signals generated in the last 36 months precede countertrend moves that quickly dissipate.
Except as a feather in the cap of longer-term trend followers and another in a long series of reminders about where SPX , though: that’s not too interesting. After all, the sentiment extreme denoted by a weekly close below .55 result – if any of this means anything – should naturally result in a pullback or correction.
What really matters here is the activity that occurs between signal – what happens during the signal period. As we asked above:
How effective are these signals?
Over the 3 years studied, 14 of 21 signal periods featured an SPX pullback or correction.
Put another way, 67% of the time, the equity put-call ratio does signal negative market performance of some magnitude. In answer to an earlier question: though it’s by no means a sure thing, poor post-signal performance is relatively consistent.
Those periods, their individual duration and performance are featured in the image (click to zoom) below.
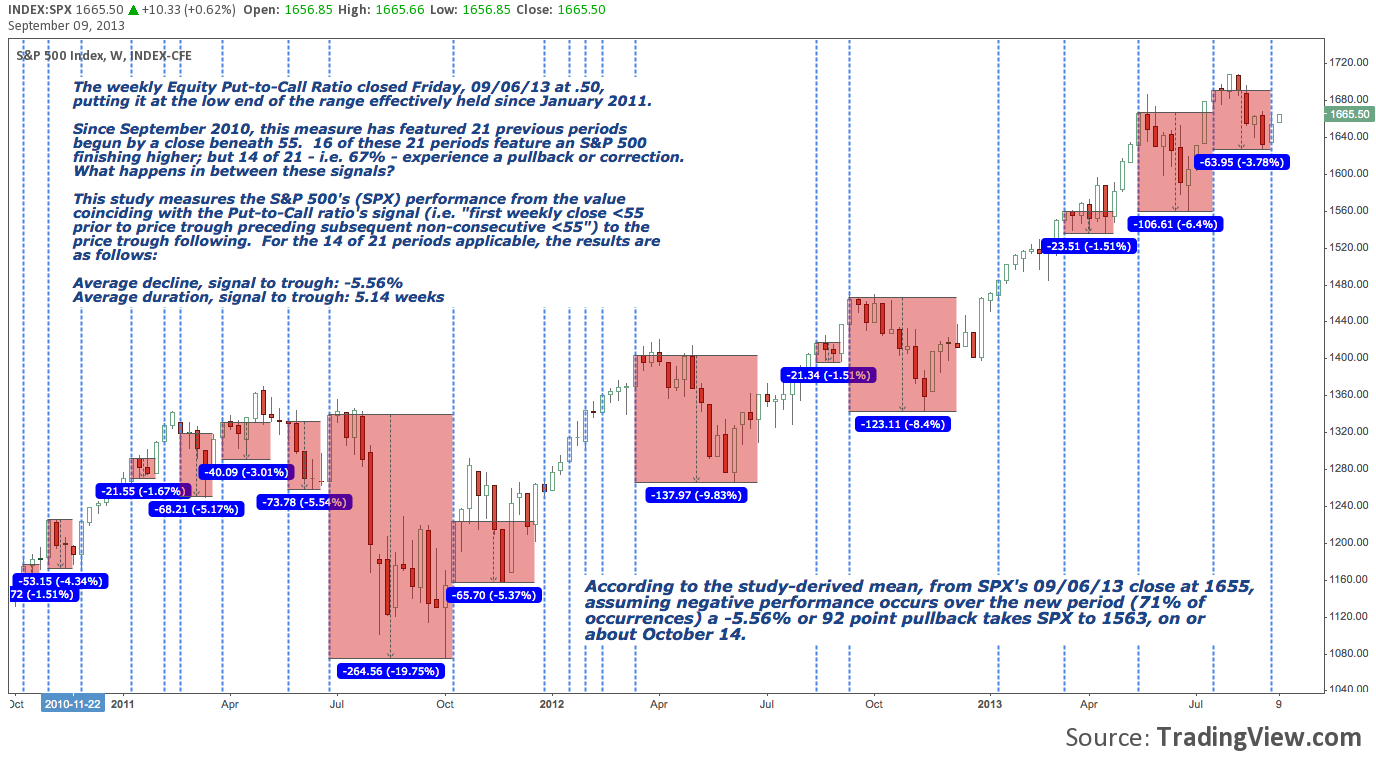
For these 14 down periods:
- The average decline from signal to price trough during the period is -5.56%
- The average duration from signal to price trough during the period is 5.14 weeks.
In summary: two-thirds of the time, the weekly equity-put call ratio signal does signal an SPX selloff. On those occasions, the selloff is about -5 1/2% and lasts a bit over 5 weeks. And then, 14 of 14 times, the trend has resumed upward.
Extrapolating from these averages and in recognition that there’s a 1-in-3 chance this is not applicable: from last Friday, 09/06/13’s signal this study (it’s mean-derived conclusion; not a recommendation) suggests SPX will fall 92 points to 1563 by mid-October.
Maybe there’s reason to worry (albeit modestly) about a market correction this month after all.
Twitter: @andrewunknown and @seeitmarket
Author holds no position in instruments mentioned at the time of publication.
Any opinions expressed herein are solely those of the author, and do not in any way represent the views or opinions of any other person or entity.
: Worrisome to Broader Market?")

: Important Breakout Retest")