Technology is the life blood of our current economy and dictates future innovation. The sector has also taken a primary leadership role in the 11-year bull market.
But, as most of you are aware, that doesn’t mean that tech stocks are always smooth sailing. In fact, the Nasdaq and tech stocks can be a bumpy ride! Just check out today’s chart!
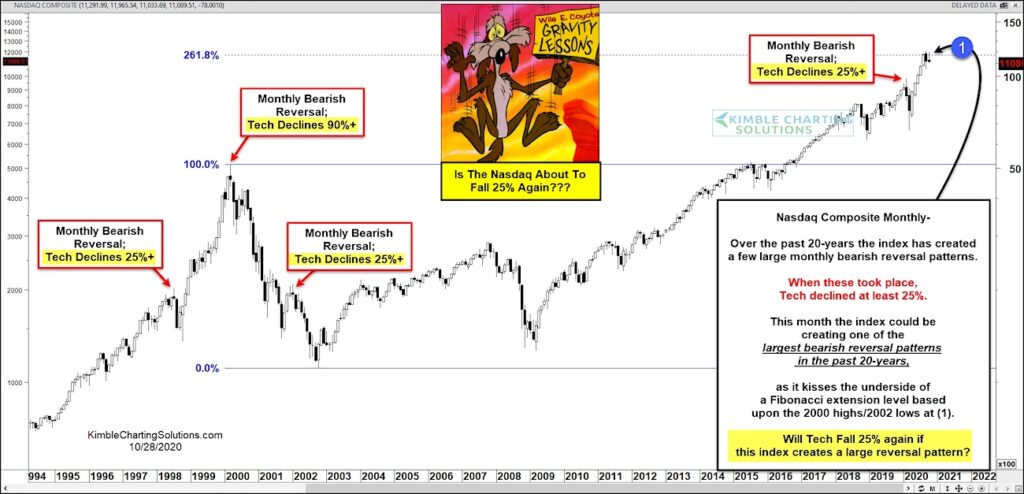
Displayed here is a “monthly” chart of the Nasdaq Composite which highlights some a handful of large bearish reversal patterns.
The month of October is not over yet (two days remaining)… HOWEVER, it appears that the Nasdaq Composite index is creating a rather sizeable bearish reversal pattern. As well, this move to the downside is occurring just after the index kissed the underside of the 261% Fibonacci extension level at (1).
Glancing back at recent history, you can see that a handful of large monthly reversal patterns have lead to significant declines of -25% or more. Should October close out at current levels and confirm this bearish reversal pattern, it would send a message of caution to investors. Stay tuned!
Note that KimbleCharting is offering a 2 week Free trial to See It Market readers. Just send me an email to services@kimblechartingsolutions.com for details to get set up.
Twitter: @KimbleCharting
Any opinions expressed herein are solely those of the author, and do not in any way represent the views or opinions of any other person or entity.

: Cup (and Maybe Handle) Watch")
 Trading Near Top Of Price Range")

