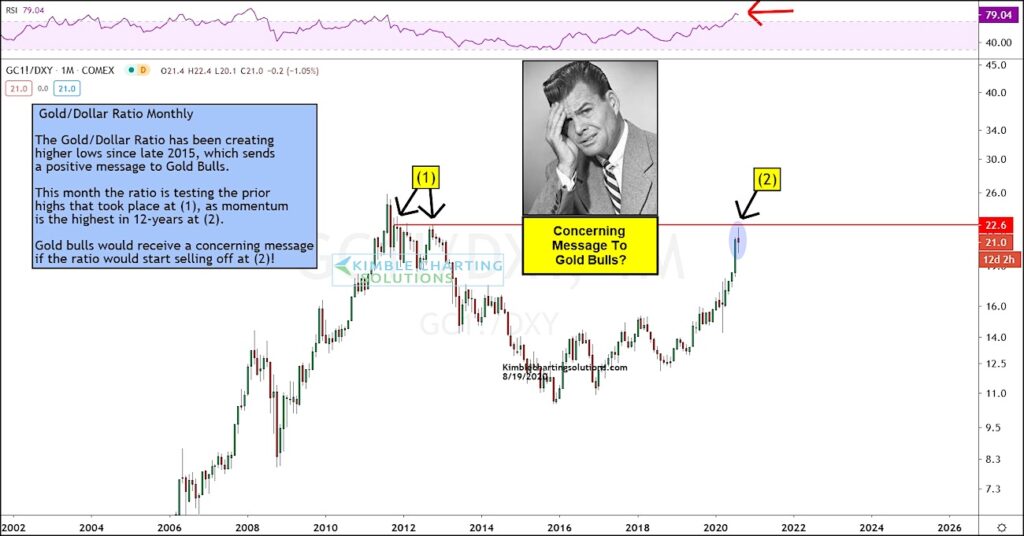
Gold / US Dollar Ratio “monthly” Chart
Gold has been a peak asset performer in 2020.
And a weakening US Dollar has fueled the latest surge higher in Gold prices. Higher we go? Or time for a breather?
Today I share one of my favorite charts: The Gold to US Dollar Index ratio (on a “monthly” basis).
As you can see, this ratio is in a long term up-trend, highlighted by higher lows throughout the rally (bullish).
This is a bullish signal longer-term. But short-term, we have a bit of caution.
The ratio is retesting its all-time highs and this month may be forming a bearish reversal wick at (2). Gold bulls would receive a concerning message if the ratio turns lower. Stay tuned!
Note that KimbleCharting is offering a 2 week Free trial to See It Market readers. Just send me an email to services@kimblechartingsolutions.com for details to get set up.
Twitter: @KimbleCharting
Any opinions expressed herein are solely those of the author, and do not in any way represent the views or opinions of any other person or entity.

 Testing Important Price Support")
: Cup (and Maybe Handle) Watch")

