While most developed stock market indexes have been heading higher in 2021, the Emerging Markets ETF (EEM) has been trading sideways to lower.
The year started off with a bang for $EEM as the ETF made new highs into February before stumbling for the next 7 months.
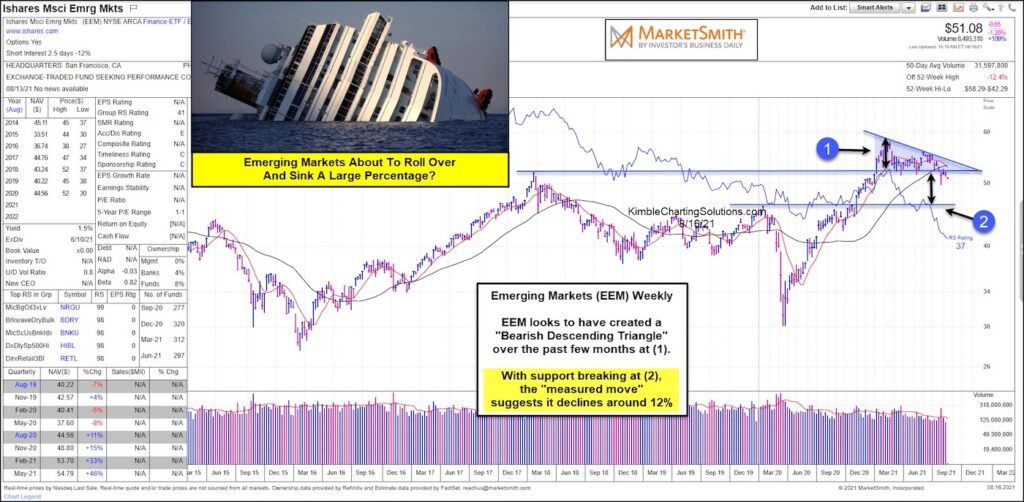
Looking at the “weekly” chart of the Emerging Markets ETF (EEM), the downward price action has formed what appears to be a bearish descending triangle over the past few months at (1).
With key technical support breaking down, it appears that $EEM could make a “measured move” decline of 12% to (2) on the chart.
Are Emerging Markets about to submerge? Stay tuned!
Emerging Markets ETF (EEM) “weekly” Chart
Note that KimbleCharting is offering a 2 week Free trial to See It Market readers. Just send me an email to services@kimblechartingsolutions.com for details to get set up.
Twitter: @KimbleCharting
Any opinions expressed herein are solely those of the author, and do not in any way represent the views or opinions of any other person or entity.


