Telehealth is not the new healthcare in 2025, but it has become an integrated and essential part of the healthcare landscape, transforming delivery, access, and convenience.
First off, some legislation.
Physicians and practitioners may now use two-way, real-time audio-only communication technology for any telehealth service furnished to a patient in their home, assuming the practitioner has the audio-video means.
The global telemedicine market size is calculated at USD 160.13 billion in 2025 and is predicted to increase from USD 188.93 billion in 2026 to approximately USD 709.69 billion by 2034, expanding at a CAGR of 17.99% from 2025 to 2034.
Teladoc Health (NASDAQ: TDOC) is widely considered the largest telehealth company by revenue and global reach, though other companies have a significant market presence.
Teladoc Health (TDOC) has a new integration with TytoCare to enhance virtual primary and urgent care with at-home diagnostic tools. This is big news.
The consensus estimate for TDOC’s 2025 revenues indicates a year-over-year decline, but the same for 2026 suggests a year-over-year increase. The consensus estimate for 2025 and 2026 EPS indicates year-over-year increases.
On November 14, 2025, Kenneth Paulus, a Director at Teladoc Health, purchased 10,000 shares of the company’s stock.
Let’s take a look at the stock.
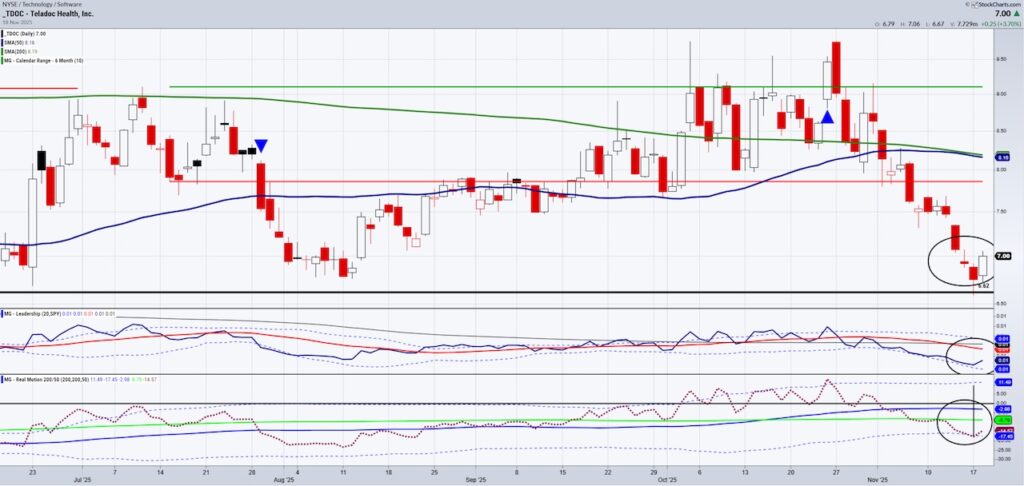
On the Daily chart, the black bold horizontal line at the bottom shows the massive support around 6.50 going back to the April lows 2025.
Today, after making a new 60+ day low on November 17th, it closed strong.
The volume was solid albeit not epic.
The first ellipse on the chart shows you the price reversal.
The next ellipse shows our Leadership indicator.
While Teledoc continues to underperform SPY, today it did gain some traction.
The final ellipse on the bottom is most interesting.
There was a mean reversion to the buy side when the red dots crossed back over the dotted lines or Bollinger Bands.
The most bullish thing about the Real Motion momentum indicator is that the 50-day moving average (blue) sits above the 200-DMA (green). And while the red dots are below, that tells us this stock has potential.
Of course, we want to see the price
- Hold the recent lows
- Continue moving up closer towards 50 and 200-DMAs on the price charts or to around 8.15.
Most importantly, it’s always great to know your risk, especially when it’s limited.
Twitter: @marketminute
The author may have a position in mentioned securities at the time of publication. Any opinions expressed herein are solely those of the author and do not represent the views or opinions of any other person or entity.


