Home Investing Research Is S&P 500 Nearing Turning Point With Spring Equinox?

Is S&P 500 Nearing Turning Point With Spring Equinox?

0
Is S&P 500 Nearing Turning Point With Spring Equinox?

It is always worth keeping a close eye on the stock market price action around this time of year.

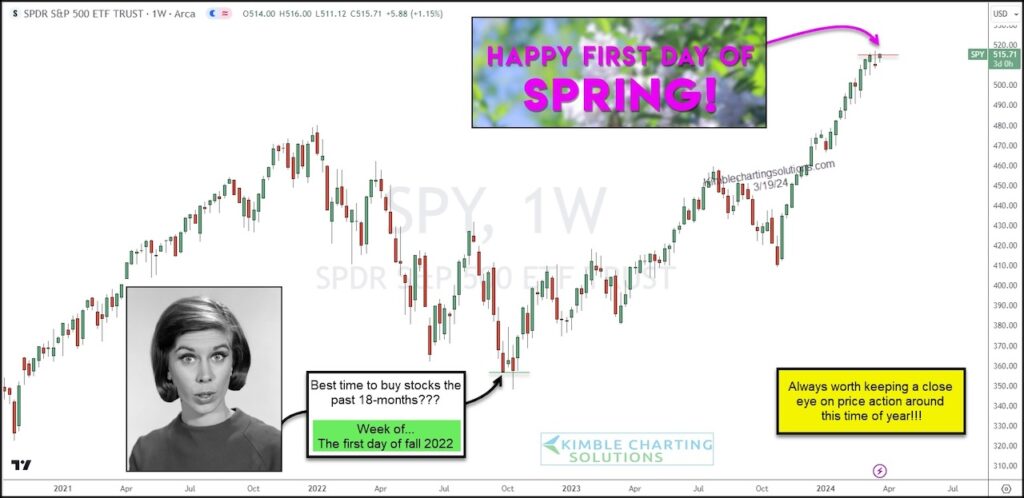
18 months ago, it was the first day of fall that seemed to be a great time to buy stocks… and again this last fall. Heck, even spring of 2023 was good. But the broader points is that many turning points (up or down) seem to be magnetized to these seasons.

In today’s “weekly” S&P 500 ETF (SPY) chart, we can see this. But more notable is what has been happening since the stock market bottomed last fall. In basic terms, SPY has gone straight up in a very strong bull market rally. But the seasonal Spring equinox is upon us.

In the past 3 weeks, the S&P 500 has consolidated as it awaits the outcome of the March 20 Federal Reserve meeting… and into the first day of spring!

Sign up for our FREE newsletter
and receive our best trading ideas and research


It’s that time of year. Will we get a breakout or a turn lower? Stay tuned!

S&P 500 ETF (SPY) “weekly” Chart
s&p 500 etf spy trading into important price peak chart federal reserve news march 20

Note that KimbleCharting is offering a 2 week Free trial to See It Market readers. Just send me an email to services@kimblechartingsolutions.com for details to get set up.

Twitter:  @KimbleCharting

The author may have a position in mentioned securities. Any opinions expressed herein are solely those of the author, and do not in any way represent the views or opinions of any other person or entity.

Previous article Nasdaq 100 ETF (QQQ) Downside Risk Price Targets
Next article QE By A Different Name Is Still QE
Avatar photo
Chris Kimble is the founder and CEO of Kimble Charting Solutions. His firm provides research for individual investors, financial professionals, 401k managers and hedge funds around the world. He specializes in pattern analysis in stock indexes, bonds, currencies, commodities and individual stocks, using pictures to highlight the opportunity at hand with a touch of humor. His mission is to help investors enlarge portfolios regardless of market direction. Chris has 33 years of experience in the financial industry. He spent 25 years as a financial planner, before turning to helping people capitalize on the Power of the pattern. With a business and psychology background he combines the footprint of pattern analysis with investor sentiment extremes to find opportunities and solutions for investors. You can read more about Chris on his website Kimble Charting Solutions https://kimblechartingsolutions.com/.