Key Stock Market Takeaways (for week ending August 14):
– The weight of the evidence has shifted from bullish to neutral.
– Excessive investor optimism is emerging as the stock market calendar argues for more caution.
– Market Breadth is now bullish as rally participation continues to expand.
The weight of the evidence, our primary risk management tool, has deteriorated.
This is not a market timing tool, but an effort to provide an objective assessment of risks and opportunities, specifically as it relates to the stock market.
We made three changes in our latest weight of the evidence update. Sentiment has moved from neutral to bearish, Seasonal Patterns dropped from bullish to neutral (the upcoming election is likely to provide ample noise and volatility), and Breadth was upgraded from neutral to bullish.
In sailing parlance, this week’s downgrade is an indication that the environment is getting a bit more unstable. The water is becoming choppier and the wind more blustery. It might be a good time to readjust the sails and proactively consider risk tolerances.
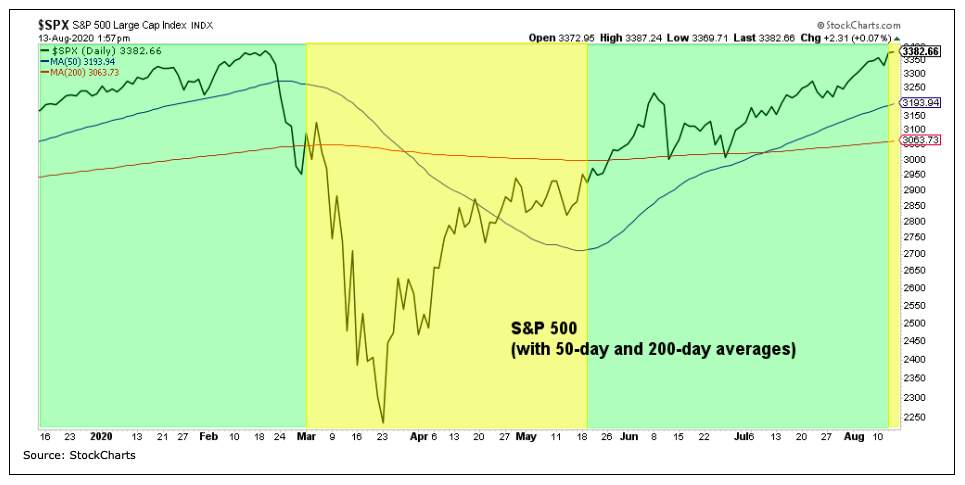
After a historic rally off of the March lows, the S&P 500 Index is now in the vicinity of its February peak. This has fueled investor optimism and while overall breadth has turned bullish, the average stock has not seen as complete a recovery as the mega-cap market leaders. Half of the stocks in the S&P 1500 are still 20% or more below their highs.
For perspective, the weight of the evidence came into 2020 suggesting a bullish tailwind for stocks. The tone became more cautious from early March to mid-May (at which point it shifted back to bullish). If rising volatility prompts investors to turn more cautious, the weight of the evidence could return to the bullish mode in relatively short order. If, however, rising volatility leads to broad market deterioration, we could see a further downgrade in the weight of the evidence.
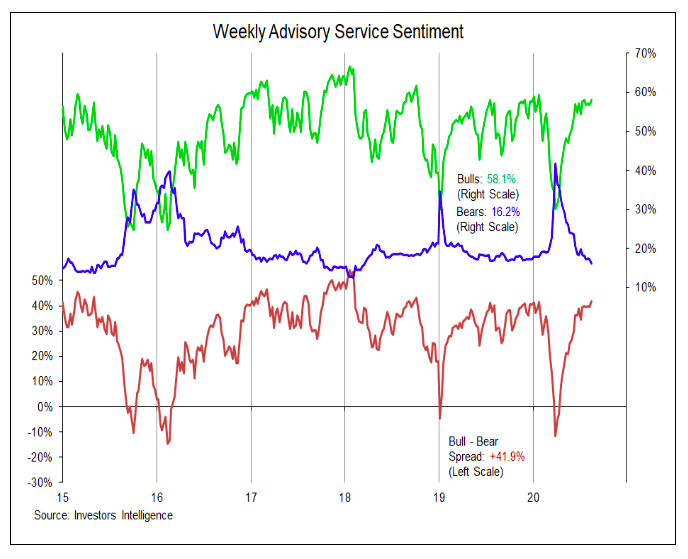
Sentiment has been moving toward optimism for some time. This week was saw sufficient evidence to suggest that optimism is excessive. The latest data from Investors Intelligence shows bulls nearing 60% and bears dropping to their lowest level since early 2018. While signals from this indicator associated with excessive pessimism can be more timely than those associated with excessive optimism, bears undercutting their 2019 lows this week caught our attention. This lack of concern is also reflected in the options data. The 10-day put/call ratio is as low as it has been at any point in the past decade.
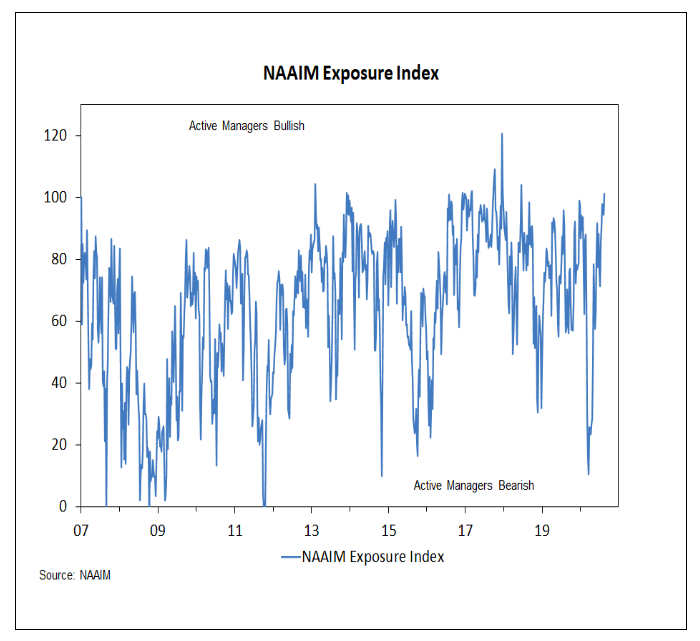
While this week’s NAAIM exposure index data had not been released when we made the call to downgrade sentiment, it does suggest that was the right decision. The exposure index jumped above 100% this week (it was 10% at the March lows). There is relatively small sample of readings over 100, but the overall market reaction in the past has not been one of continued smooth sailing.
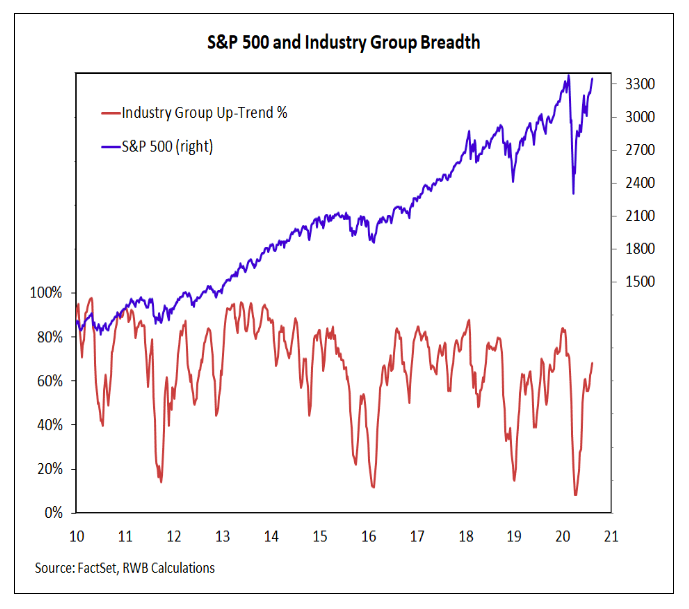
From a breadth perspective, we have been encouraged by the continued expansion of industry groups in up-trends (now up 68%) and continued strong readings from our sector-level trend model. The industry group trend indicator can be seen in the chart to the right, but both of these important indicators get updated in our weekly Market & Sector Trend Summary report.
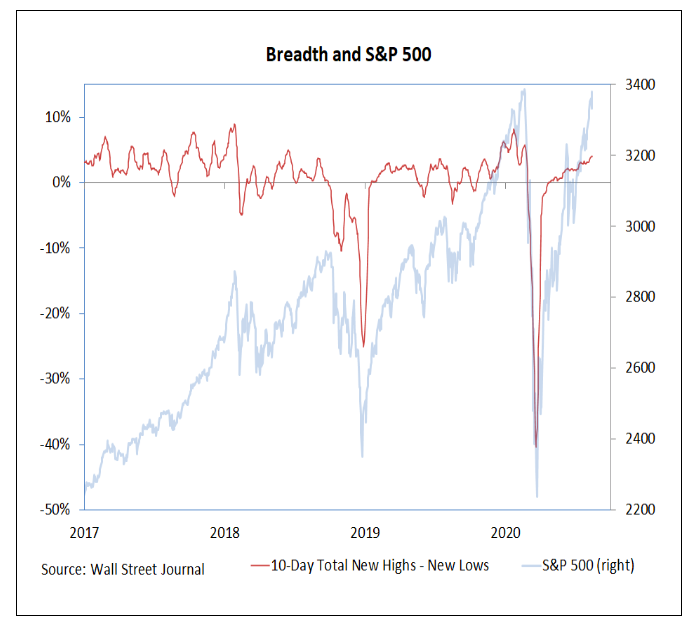
Data on new highs has been more mixed. The number of S&P 500 stocks making new highs has stumbled in recent weeks, though other areas of the market have seen new highs expand. Whether it is fair to look for stocks to be making new highs if the indexes are not is a fair question. For now we can look past the aggregate level and instead look for a trend that continues to improve. That can be seen in the 10-day total of new highs less new lows on the NYSE + NASDAQ. While shy of the early-year peak, it is continuing higher after reaching exhaustion lows in March. That is encouraging from where we sit.
Twitter: @WillieDelwiche
Any opinions expressed herein are solely those of the author, and do not in any way represent the views or opinions of any other person or entity.


