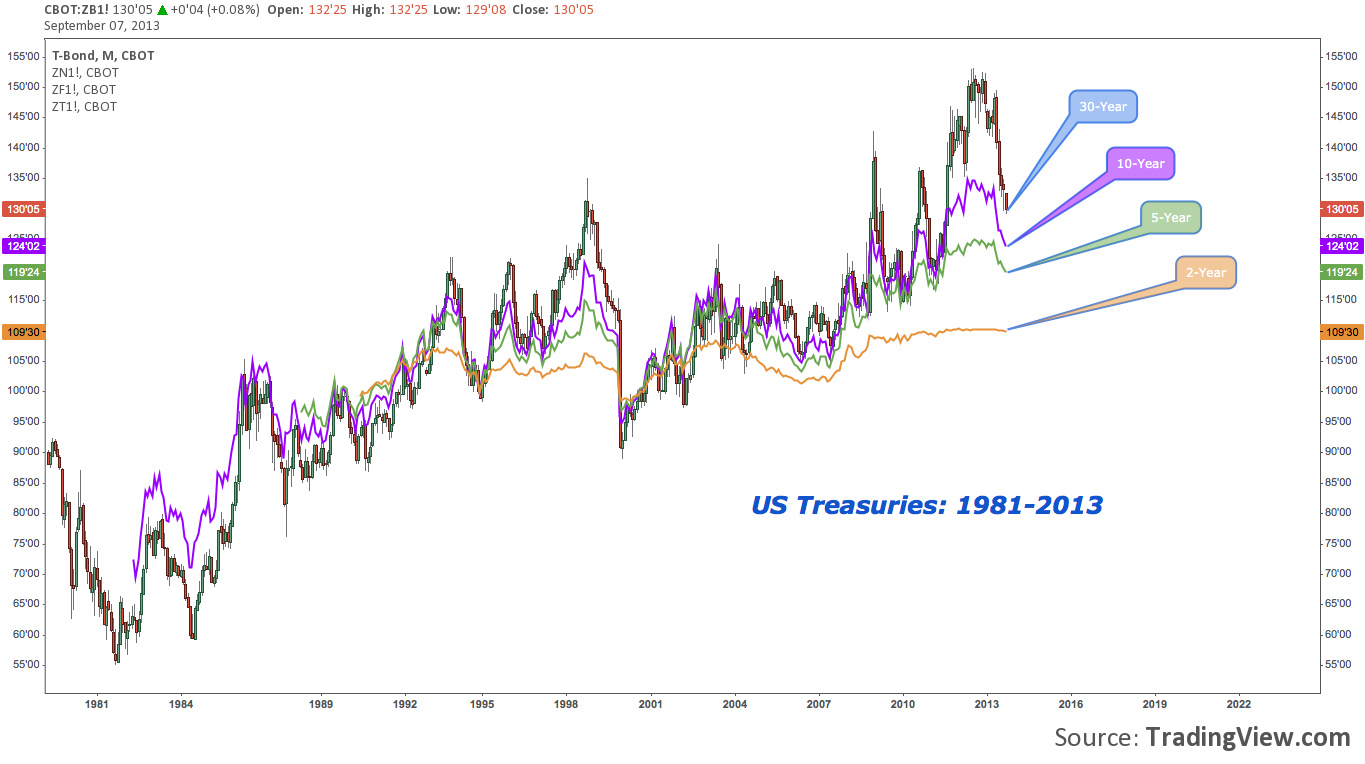
 By nearly all accounts, the secular bull market bonds have cycled through since the early 1980s is in its final days.
Almost too neatly, faint murmurs of an LSAP “taper” got underway in early May and quickly crescendoed into a ruthlessly effective catalyst for capping the generational bond rally, producing a sharp and as-yet-sustained move higher across the long end of the Treasury yield curve.
Speculation that bonds as an asset class long ago ballooned into an asset bubble is nothing new. The grand narrative of a “Great Rotation” of capital flows out of bonds and into equities, while facile, has passed in and out of popularity depending on the vagaries of financial markets; but has lingered as a stubborn theme now for years. It seems bonds in general – and those instruments carried in bulk on the Fed balance sheet like US Treasuries and Mortgage-Backed Securities, in particular – just needed a slight nudge to begin their long fall from the great height attained by 32 years of (generally) advancing prices.
Though there’s been some back-and-forth on it, the September FOMC (09/17-09/18) is widely seen (including by economists at most Primary Dealers – US banks essential to the Fed’s POMO machinery) as the meeting when the taper will begin; thereby heralding the beginning of the end of the Age of Accommodation and a tightening regime that will take bond prices lower and yields higher for years to come.
But, no market turn so massive moves in a straight line.
And now on the reputed eve of the taper actually kicking in (as opposed to the months-long, “sell on rumor” front-running FI portfolio reallocation), it is with no small hint of irony that I note Treasuries look set to install a – at least – short-term rally. If bonds continue their soundless, deafeningly persistent mockery of the Bernanke Fed’s intellectual policy orthodoxy, that rally would begin sometime in the next couple weeks.
As improbable as it may seem, a “buy the news” US Treasuries rally – September FOMC taper announcement or not – may be right around the corner.
On the heels of the real Summer Swoon (in bonds this year), buying US Treasuries in expectation of a bounce is not something done casually (to be clear, I’m not recommending that – or anything else – here). Indeed, the more volatile medium-to-long-dated side of the curve – 10-30 years out – looks like a razor-honed falling knife ready to cleave away the sinew and bone of anyone daring to go long.
Now with that dire preface out of the way, let’s flip through a series of charts concentrating on the 10 year T-Note (ZN; and TNX for yield) and 30 year T-Bond (ZB; and TYX for yield) that may suggest a contrarian willingness to take that dare is well-placed.
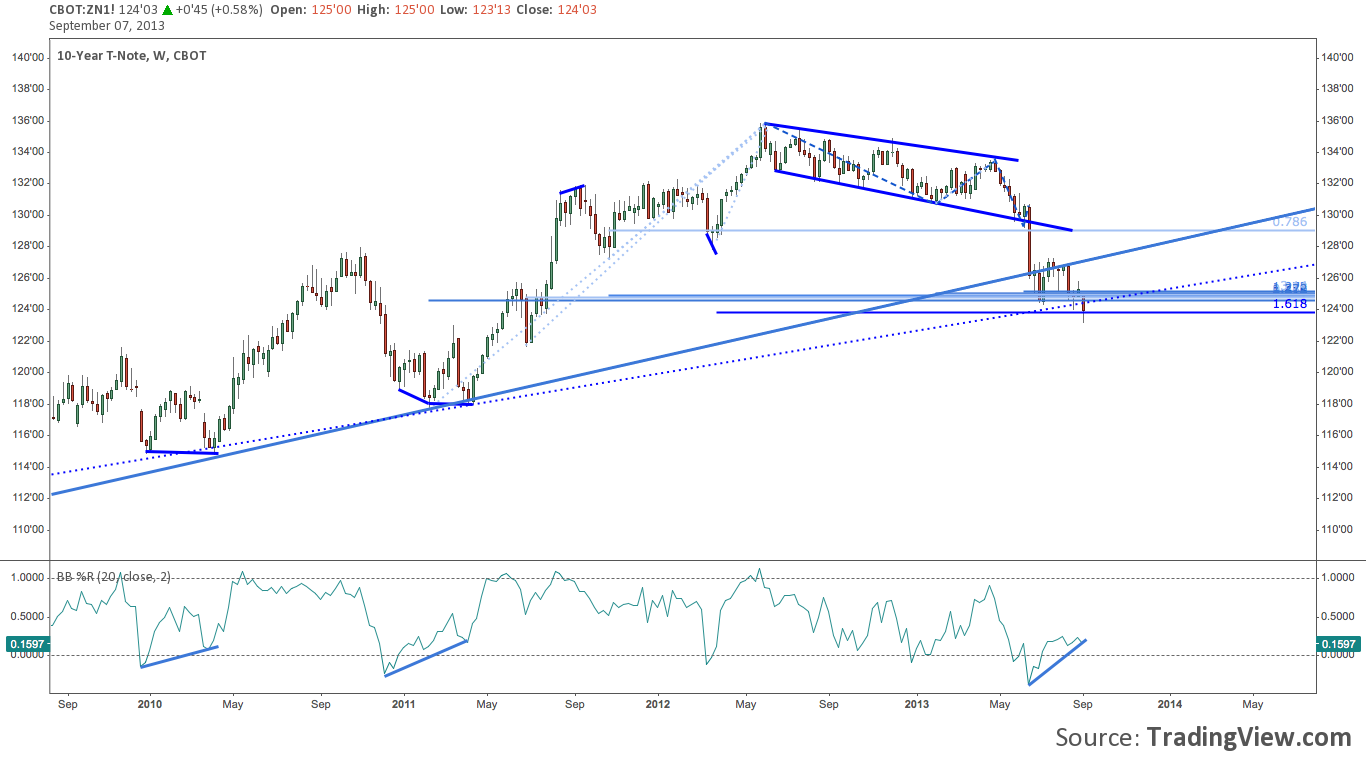
The rate and depth of change on the 10 Year US Treasury (ZN) is the most dramatic across the entire Treasury complex. In the first chart below, ZN breaks from its modest descending channel in May as taper talk began in earnest; and then snapped its primary rising trend line after Bernanke’s pseudo-hawk performance Q&A performance after the June FOMC on 06/19. The 10 year made back a bit of ground throughout July and early August after bouncing at cluster support near 125, but failed at support-turned-resistance and has sinced moved lower to test the lower end of cluster support around 123.
US Treasuries Rally: 10 Year T-Note (ZN) – Weekly
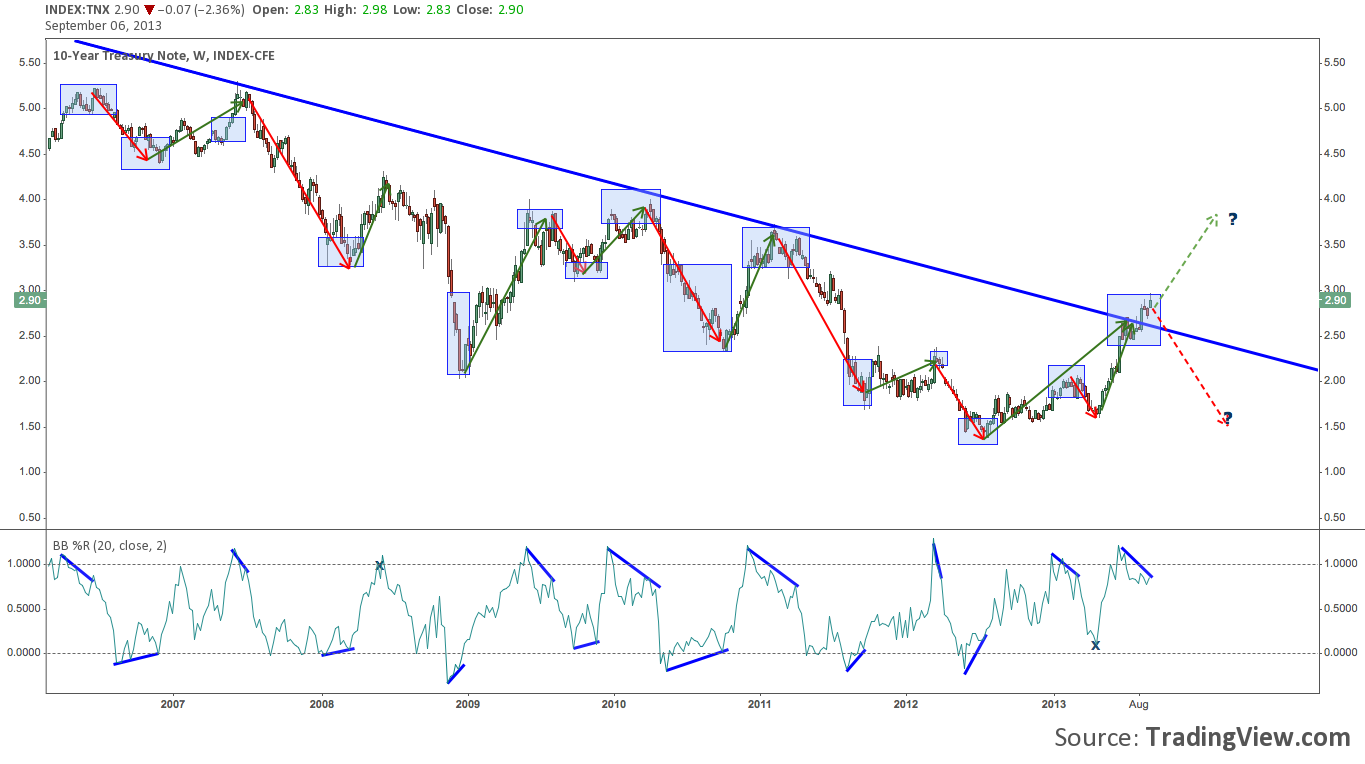
The 10 Year yield (TNX), not coincidentally, has broken above ZN‘s mirrored trend line, as shown below, closing Friday at 2.93% after a brief incursion into 3% handle in thin overnight pre-NFP trade. Below, the major secondary moves stamped out by TNX are denoted by red and green arrows (click image to zoom). Blue boxes sync with the blue lines in the bottom panel (featuring %B, a volatility/momentum indicator that measures the position of price vis-a-vis its Bollinger Bands).
A quick study below discovers the 10 Year is highly responsive to its Bollinger Bands; and similarly that %B has a uncannily prescient knack at carving out negative and positive divergences that almost always suggest a major turn is afoot. A glance back at ZN above shows the mirrored %B signals. In both cases, the primary trend line is busted; but, the contrary signal of a negative %B divergence is present.
This begs the question: which signal deserves preference? The trend line break has longer-term implications; and in fact we may be examine the very beginning of a multi-decade secular bear market for bonds. But with a shorter-term outlook (say, 6-12 months), this divergence is highly, perhaps more pertinent – especially given that ZN/TNX post-breakout momentum has been less than inspiring. The September FOMC may be just the catalyst to create that inspiration, resolving this divergence by popping %B back into rarefied heights above 100 (where it does not tread long or often).
But what if, as alluded to above, the September FOMC becomes a “buy the news” event? This divergence may presage a breakout failure; or at least a return to test the TNX trend line near 2.45%.
The falling knife risk is obvious; but the risk for the long-side is not negligible, either.
US Treasuries Rally: 10 Year T-Note Yield (TNX) – Weekly
Now we’ll turn to the 30 Year US Treasury T-Bond (ZB), which is really just a slightly less volatile (for a combination of reasons beyond the scope of this post) variation on the theme above.
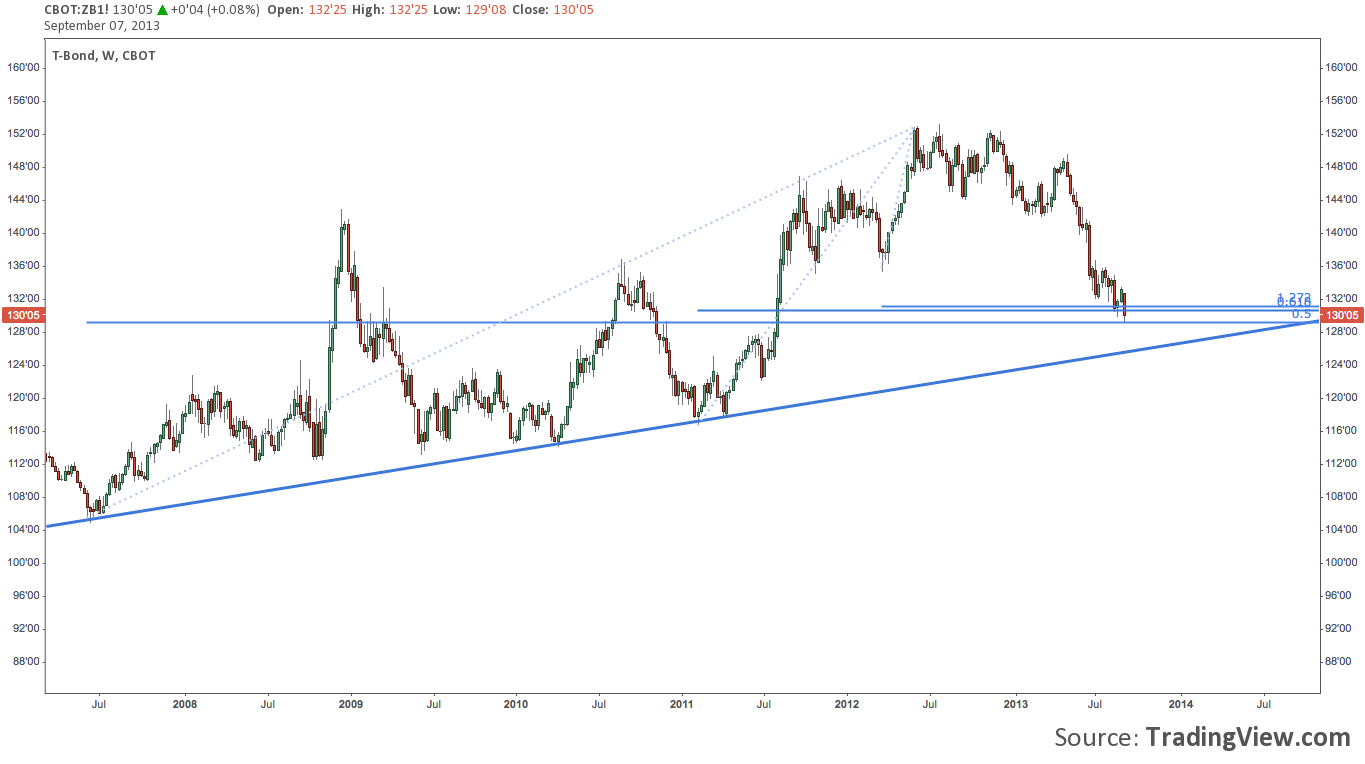
Critically, ZB has not broken below primary rising trend line. Arguing from the far extreme of the yield curve, USTs have still had the stuffing beaten out of them since May, but haven’t produced the dire technical implications present on the 10 Year. Additionally, the ZB is pressing at medium-term cluster support between 130-132.
US Treasuries Rally: 30 Year T-Bond (ZB) – Weekly
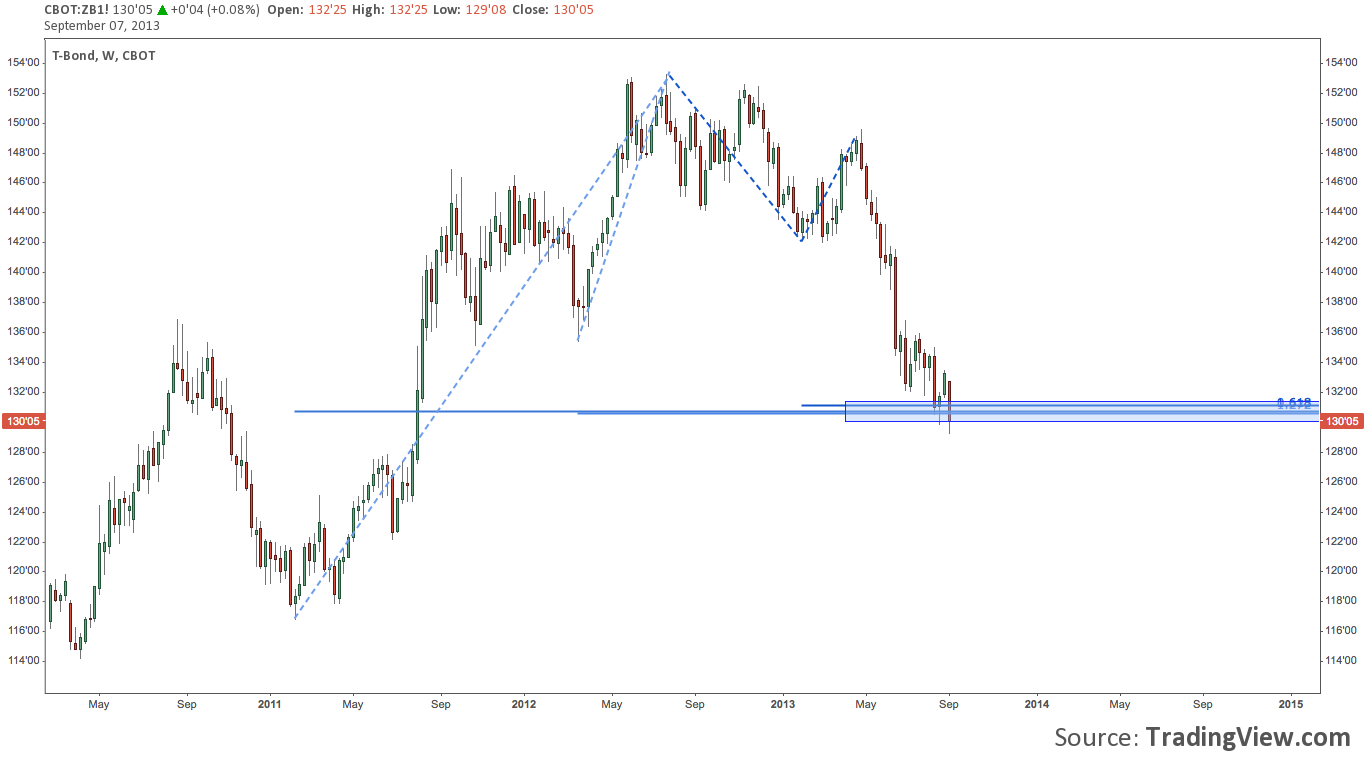
A second, closer view of 30 Year weekly dials the 130-132 cluster support window in a little more clearly:
US Treasuries Rally: 30 Year T-Bond (ZB) – Weekly 2
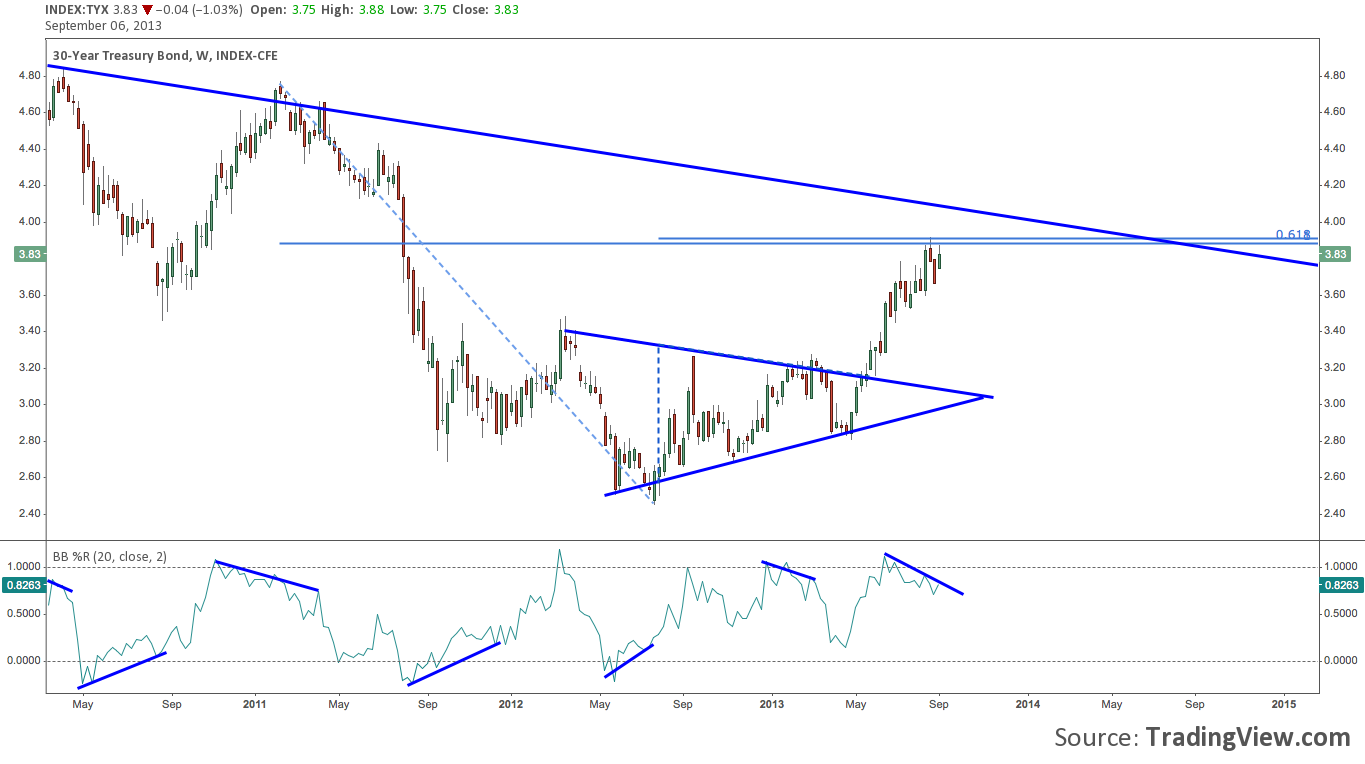
Mirrored cluster levels on the 30 Year yield (TYX)? Oh Yeah. Notice %B in the lower panel again: those divergences can be lengthy (3 months, give or take), but when price snaps to adhere to them, it does so quickly and resolutely. The upside yield breakout from the Spring 2012-Spring 2013 symmetrical triangle in May initiated the latest such divergence as TYX presses into the 3.85-4% window.
US Treasuries Rally: 30 Year T-Bond Yield (TYX) – Weekly
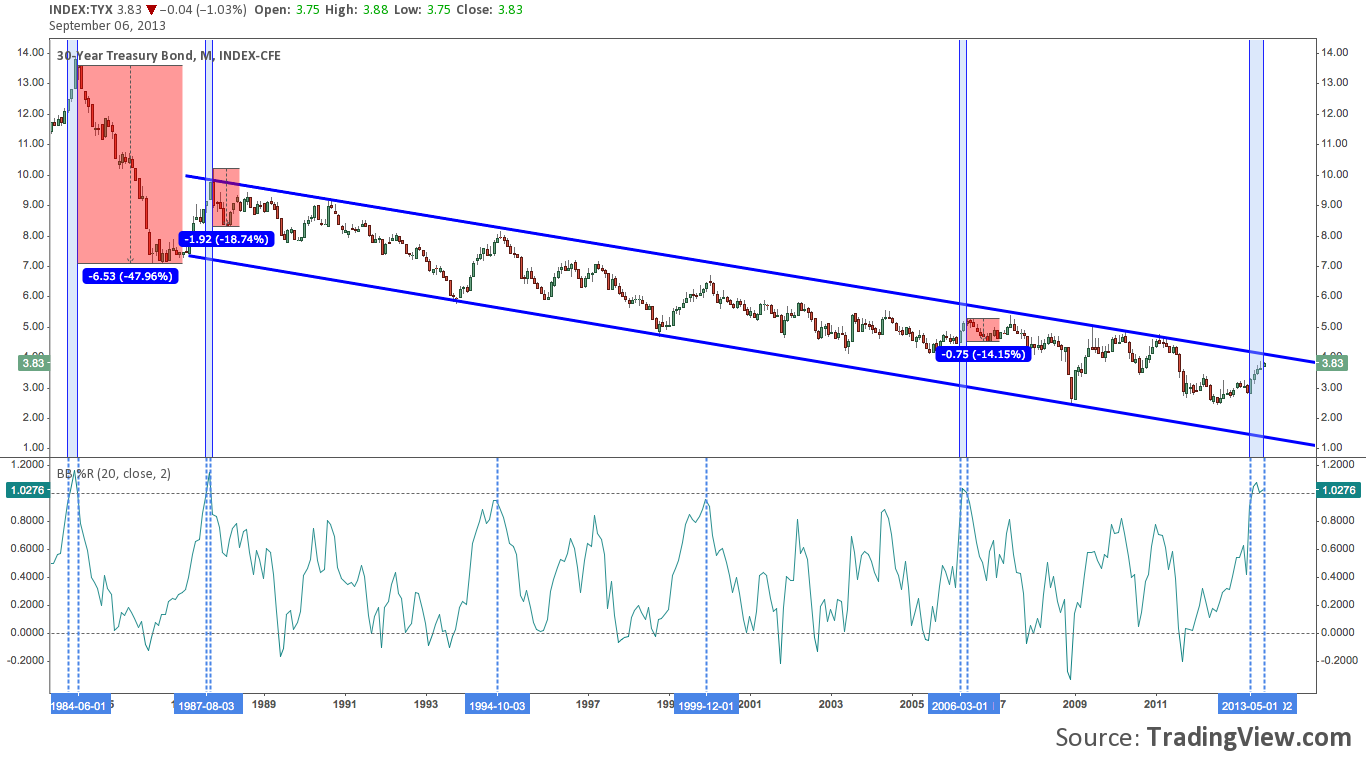
Zooming out to a very wide view, the final two charts below are of the 30 Year Yield Monthly chart. Typically, this time frame has little to say of immediate relevance. Now is one of those times of rare eloquence.
Looking at the way to the left, check out the staggering -6.5% drop in 1984-1986. What preceded it? TYX spent 3 months above its upper Bollinger Band in April-June 1984.
Similarly TYX %B lingered above 100 (i.e. price closed above the Upper BB) for 2 months from August-October 1987. Coming off the reflexive pop in yields after 1984-1986’s drop, the decline resumed apace in November 1987. Peak to trough, by February 1988 yields dropped nearly 19%. This move was significantly retraced through 1988, but the trend begun in 1981 remained firmly in place.
The last time TYX monthly breached its upper BB was April-May 2006, prompting a -14% drop in yields from 5.31% to 4.56% by November of that year. In a major negative divergence, TYX fully retraced this move, pushing as high as 5.41% in March 2007 but on comparatively tepid momentum. The rally in the 30 Year that followed continued unabated until December 2008, where yields bottomed out almost 300bps lower at 2.52%.
And the fourth TYX monthly %B print over 100, all the way to the right? It’s ongoing, begun in May 2013.
US Treasuries Rally: 30 Year T-Bond (TYX) – Monthly
As you may expect out of a monthly chart, very few of these signals occur (once every 7.5 years, on average). The result is pitifully low sample space. Then again, we’re not backtesting a method, but getting the broad technical lay-of-the-land. Nevertheless, let’s loop in the two “almosts” (as defined by a “monthly close >%B 95” criterion) in 1994 (a huge year for bonds for anyone that was there) and 1999, as shown below.
In 1994, TYX %B closed above 95 in September at 7.82%, preceding the yield top by 2 months at 8.17% in November. Yields bottomed 225bps lower in January 1996 at 5.92%, a 27.5% decline before installing a 50% retrace of that move; and then rolling over once more.
Then in 1999, a nearly identical scenario began. %B closed in December at 95.56 with TYX at 6.48%. The yield capped off at 6.75% in January 2000 and fell with little reprieve until November 2001, where it bottomed at 4.66% for a peak-to-trough decline of 209bps, or -31%.
US Treasuries Rally: 30 Year T-Bond (TYX) – Monthly 2
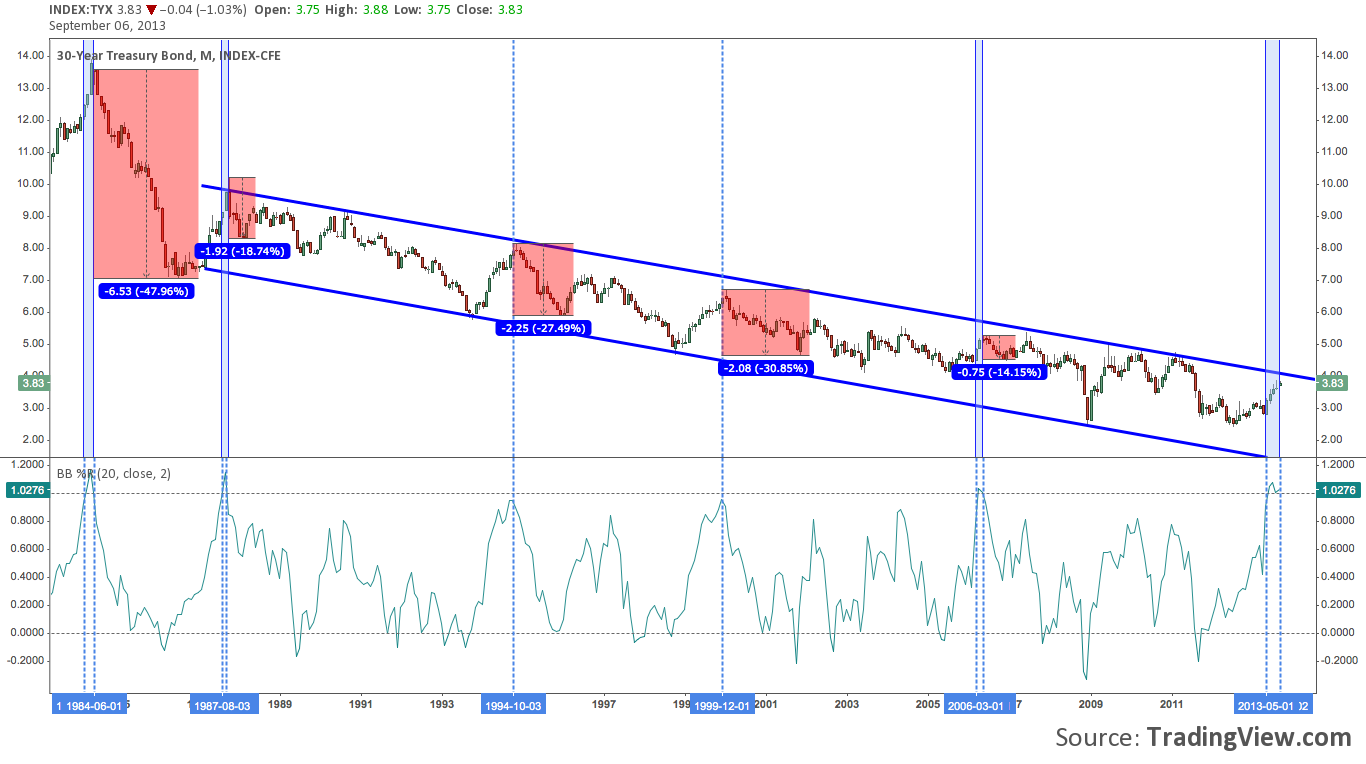
As a small collection of outliers, there’s no pretense of statistical veracity here. Nevertheless, the data – such as it is – is uniform: 5 occurrences, 30 years, for an average decline of -27.84% in yields. Extrapolating for the current period off of Friday’s close on TYX at 3.87%, that would mean a 108bps decline in yields to 2.79%.
These declines do take some time to unfold – approximately 1.5 years, on average. In the current context, it’s difficult to see how a protracted, material decline of 100bps+ over 12 months+ could occur: the monetary policy regime does not seem to support it. However, the counter-trend moves of the last 30 years suggest this is possible.
Not Dead, Yet.
Is the US Treasury secular bond bull market dead? Given the immediate evidence of an impending bounce, it may be safer to conjecture it isn’t dead yet. It’s an uncomfortably nebulous conclusion to make as an investor or trader, I know; but then actual certitude about markets is incredibly rare. Though it seems farcical now, the coming months may prove just how tightly the bull is clinging to life – even if the 32 year party is ultimately over.
Twitter: @andrewunknown and @seeitmarket
Author holds no positions in instruments mentioned at the time of publication.
Any opinions expressed herein are solely those of the author, and do not in any way represent the views or opinions of any other person or entity.


: Showing Some Signs of Emerging Strength")
