The Russell 2000 Index has enjoyed a multi-week run higher, giving rise to small cap stocks leadership in the broader market. However, the rally may be in jeopardy in the days/weeks ahead.
The ratio of the Russell 2000 Index to the S&P 500 Index reversed lower on Monday (as the index itself recorded a bearish engulfing price candle). It will be important to watch for further evidence of the recent trend higher breaking down over the next couple weeks. Given how extended the Russell 2000 has gotten, this will be important to watch into January.
Demark indicators now show completed 9-13-9 patterns on daily charts while the weekly chart also shows completed counter-trend sell signals.
Thus, small cap stocks do indeed look vulnerable heading into January… and perhaps Monday’s bearish engulfing pattern on the Russell 2000 will prove to be a first step towards the index starting to stall out. Stay tuned.
If you have an interest in seeing timely intra-day market updates on my private twitter feed, please follow @NewtonAdvisors. Also, feel free to send me an email at info@newtonadvisor.com regarding how my Technical work can add alpha to your portfolio management process.
Twitter: @MarkNewtonCMT
Author has positions in mentioned securities at the time of publication. Any opinions expressed herein are solely those of the author, and do not in any way represent the views or opinions of any other person or entity.

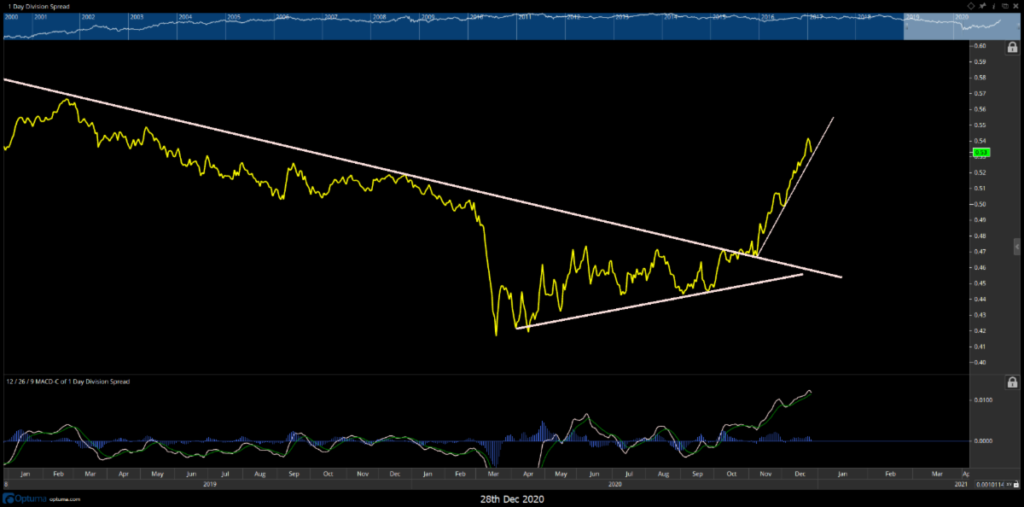
: Cup (and Maybe Handle) Watch")
 Trading Near Top Of Price Range")

