It’s been some time since the Russell 2000 has been an out-performer.
And, although we propose a potential bullish pattern on the small cap Russell 2000, please note that it is an under-performer and won’t even be worth a “trade” unless it exceeds today’s resistance.
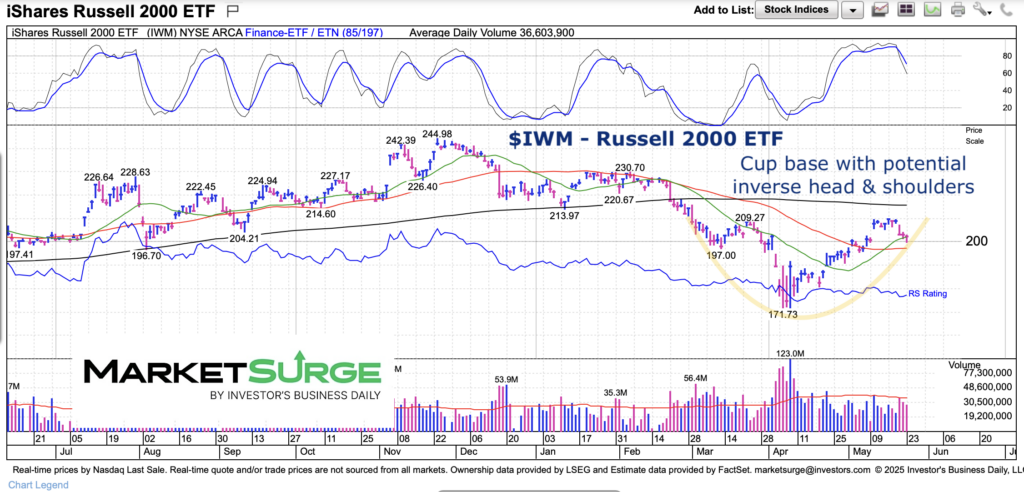
Today we highlight a bullish “cup” formation on the Russell 2000 ETF (IWM) with the potential of morphing into an inverse head & shoulders.
However, this only happens if IWM can rally and exceed the neckline (recent highs).
Note that the following MarketSurge charts are built with Investors Business Daily’s product suite.
I am an Investors Business Daily (IBD) partner and promote the use of their products. The entire platform offers a good mix of tools, education, and technical and fundamental data.
$IWM – Russell 2000 ETF Chart
The chart highlights the potential for IWM… BUT only IF price can rally and exceed (and hold) $210. Worth watching, as it could turn into a nice short-term “trade” if price rallies.
Twitter: @andrewnyquist
The author may have a position in mentioned securities at the time of publication. Any opinions expressed herein are solely those of the author, and do not in any way represent the views or opinions of any other person or entity.
: Where’s the Deflation in This?")


: Where’s the Deflation in This?")