“Intermediate and secular strength, with short-term caution — a bullish phase under pressure.”
I started to write about the Retail sector through the eyes of the Retail Sector ETF (NYSEARCA: XRT) for some time now.
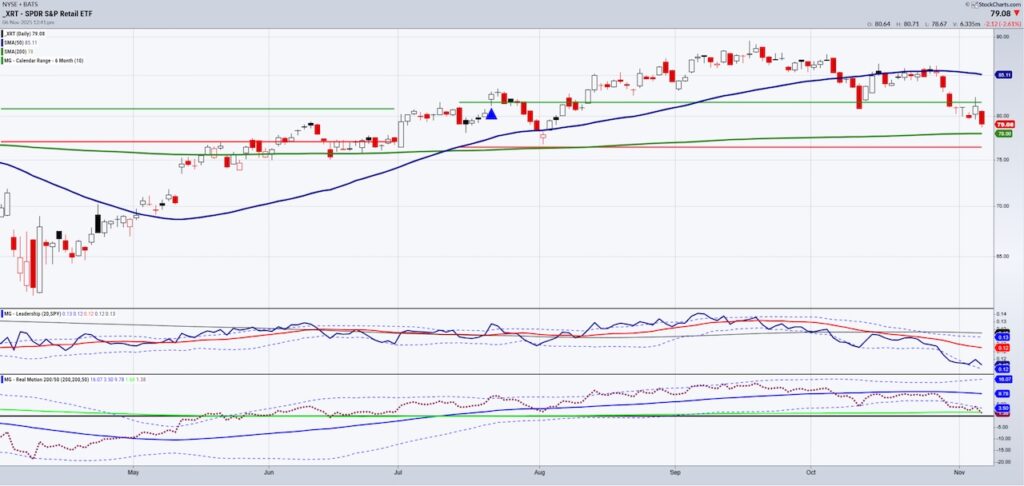
On the Daily chart, the Retail Sector (XRT) broke down under the 50 DMA (blue) early October.
Here we are one month later, and despite QQQs and SPY having made new all-time highs mid-October, our Granny could not clear back over the 50-DMA.
We call that a warning or caution phase to be taken seriously.
Especially when it is XRT, which represents the consumer or 70% of the gross domestic product.
Now, XRT comes close to testing the 200-DMA (green.)
So, the bigger question is, what now?
This is where multiple timeframes help you step back and gain a more macro perspective.
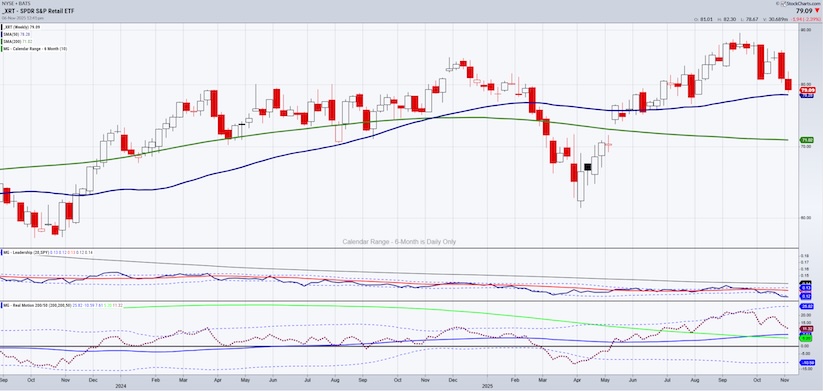
On the weekly chart, the good news is that XRT remains above the 50-week moving average.
This could suggest that the correction is just about over.
However, I will continue to watch the Daily timeframe as bulls do not want to see the price break below that 200-DMA.
Momentum or the Real Motion indicator shows support at its 200-DMA (also green).
A break of price and momentum would be a case for even more caution.
A pop in price from these lows would be more encouraging.
Another interesting timeframe is the monthly chart.
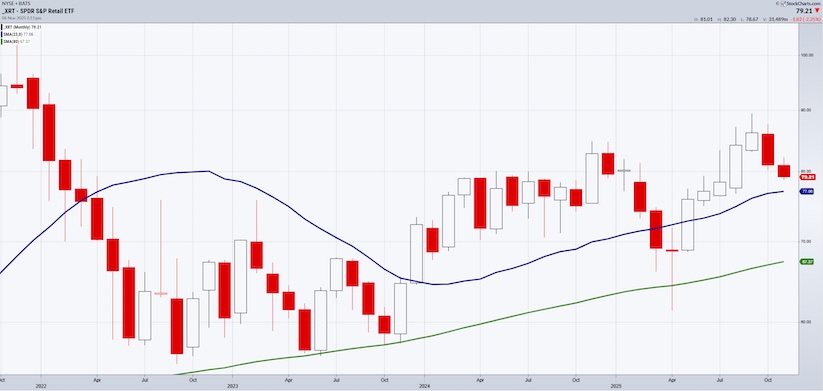
These two long-term moving averages, 23-month (blue) and 80-month (green)—are essential components of MarketGauge’s technical analysis framework to identify major market regimes and long-term trend risk.
Trend Strength & Confirmation
- If price is above both the 23- and 80-month MAs, the market is in a strong secular bull cycle.
- If price fails the 23-month but holds the 80-month, it’s a warning phase—similar to mid-cycle corrections (2007, 2015, 2018).
- A break below the 80-month MA signals a potential crisis-level or secular bear market (e.g., 2001, 2008).
Historical Examples
| Year | Market Behavior | 23M vs. 80M Levels | Outcome |
| 2000–2002 | Dot-com collapse | Broke 23M, then 80M | Secular bear market |
| 2008 | Financial crisis | Violated both | Major systemic recession |
| 2011 | Debt downgrade scare | Tested 23M, held 80M | Market recovered |
| 2020 | COVID crash | Briefly broke 23M, stayed above 80M | V-shaped recovery |
| Present (late 2024–2025) | Still above both on SPY | Bull trend intact but stretched | Watching 23M as first warning level |
Looking at XRT right now, the price is above the 23-month moving average.
Hence, retail remains in a bull trend.
Conclusion
Buyers still control the bigger picture, but sellers (or profit-taking) are pressuring the short-term.
This is often a “buy-the-dip in a long-term uptrend” environment, as long as the ETF holds above its weekly/monthly support.
If it reclaims the 50-DMA, momentum can resume higher.
If it loses both the 50-week and 23-month MAs—that’s when a real trend change risk emerges.
Twitter: @marketminute
The author may have a position in mentioned securities at the time of publication. Any opinions expressed herein are solely those of the author and do not represent the views or opinions of any other person or entity.


