Back on August 25th, we wrote a post on Nvidia’s stock (NVDA) hitting its 161% Fibonacci extension level.
Today we turn to Joe Friday and provide an update on that pattern.
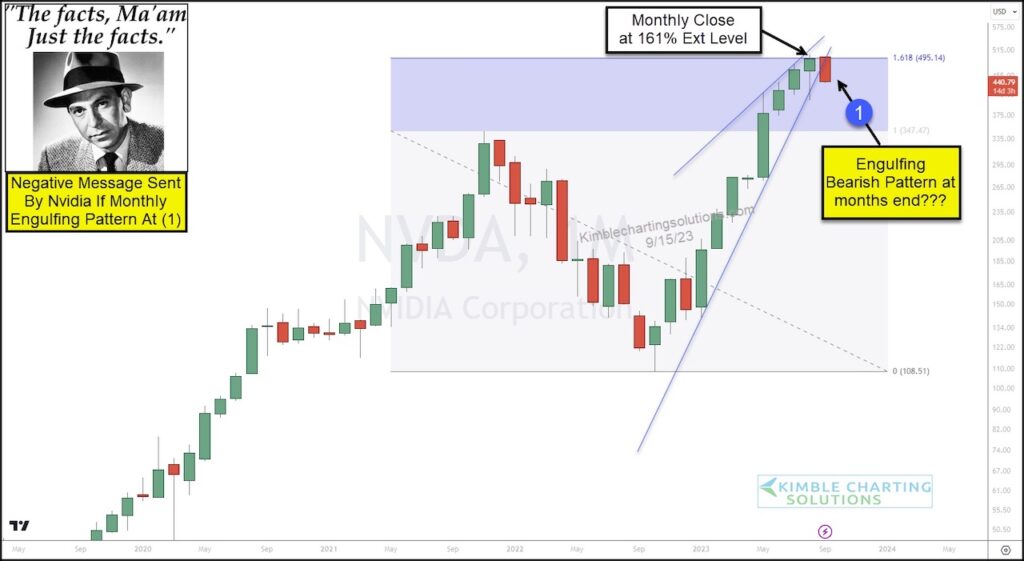
“The facts, Ma’am. Just the facts.”
As you can see, Nvidia (NVDA) closed August right at its 161% Fibonacci extension level. And this month NVDA has declined sharply.
Should further weakness take place at (1), it has the potential to close out the month with a bearish reversal and an bearish engulfing pattern.
Nvidia is unquestionably an important tech leader. And what this tech mother ship does at (1), should be important! Stay tuned!!
$NVDA Nvidia “monthly” Stock Chart
Note that KimbleCharting is offering a 2 week Free trial to See It Market readers. Just send me an email to services@kimblechartingsolutions.com for details to get set up.
Twitter: @KimbleCharting
Any opinions expressed herein are solely those of the author, and do not in any way represent the views or opinions of any other person or entity.


