2021 has been a great year for equity investors.
The Nasdaq 100 and S&P 500 ETFs are up between 20 and 25 percent on the year!
But while it’s felt like a risk-on kinda year, there’s been one missing ingredient: Junk Bonds.
Something isn’t quite right…
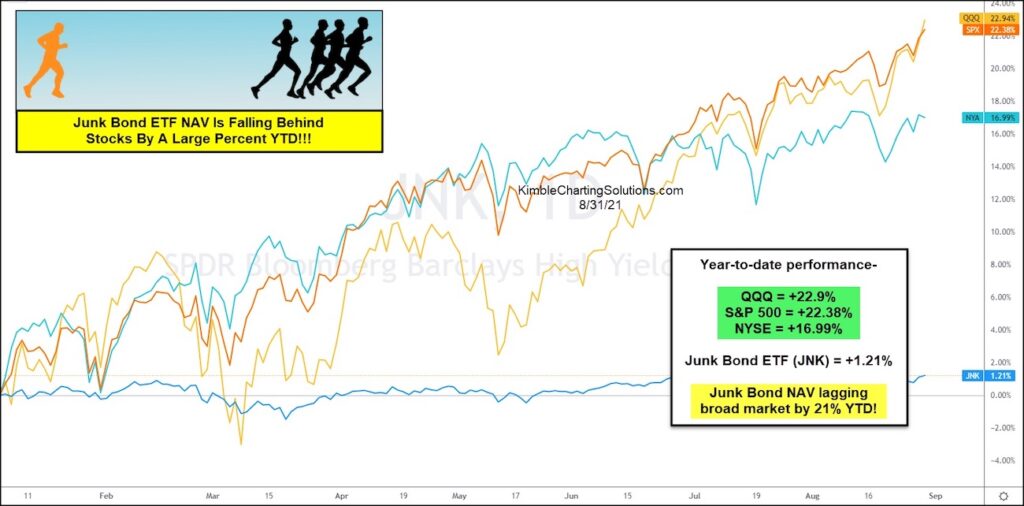
In today’s chart, we look at the year-to-date performance of key stock market indices versus the popular Junk Bond ETF (JNK). As you can see, Junk bonds are badly lagging the broader market.
Typically, junk bonds are a strong performer in a “risk-on” environment for investors. So perhaps the stock market isn’t quite as stable here as thought… and maybe a little mean reversion is coming around the bend. Stay tuned!
$JNK Junk Bonds Y-T-D Performance vs Stock Market Chart
Note that KimbleCharting is offering a 2 week Free trial to See It Market readers. Just send me an email to services@kimblechartingsolutions.com for details to get set up.
Twitter: @KimbleCharting
Any opinions expressed herein are solely those of the author, and do not in any way represent the views or opinions of any other person or entity.


