We woke up Friday morning to a huge surprise with the jobs report coming out much stronger than expected.
As the Federal Reserve looks closely at this number to help determine monetary policy, the initial reaction was fear of higher for longer interest rates.
However, as per an interview early Friday I did on Benzinga Morning Prep, is that really bad for the market in the long run?
The parabolic moves in Amazon and Meta have little to do with the overall economy if one looks at the big picture.
Nonetheless, both flew after earnings, and both helped widen the divide between small caps and growth stocks.
Plus, the risk gauges have flashed more risk off this past week.
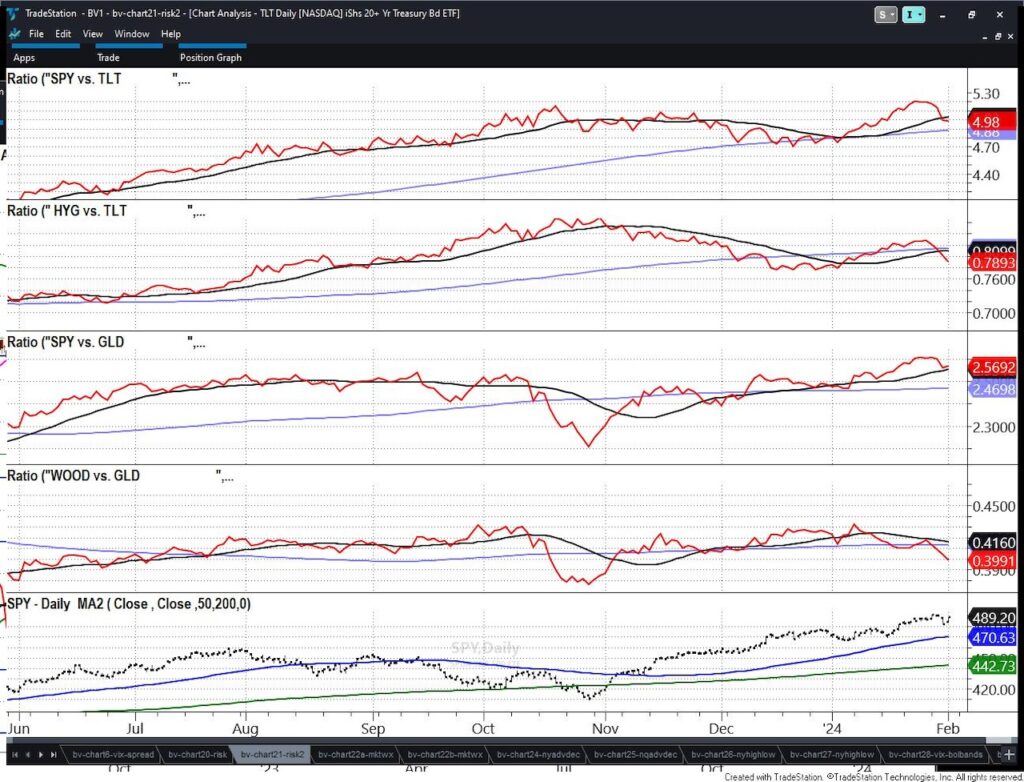
Note the long bonds TLT versus the SPY and HYG. In a risk on environment, TLT should be underperforming both.
This chart does not reflect Friday’s action, which did see SPY improve and TLT decline, which could mean more risk neutral.
The point is, aside from the few crazy stocks, the market breadth was not great.
Yet, Granddad Russell 2000 IWM and Granny Retail XRT are telling their own stories, which should not be ignored.
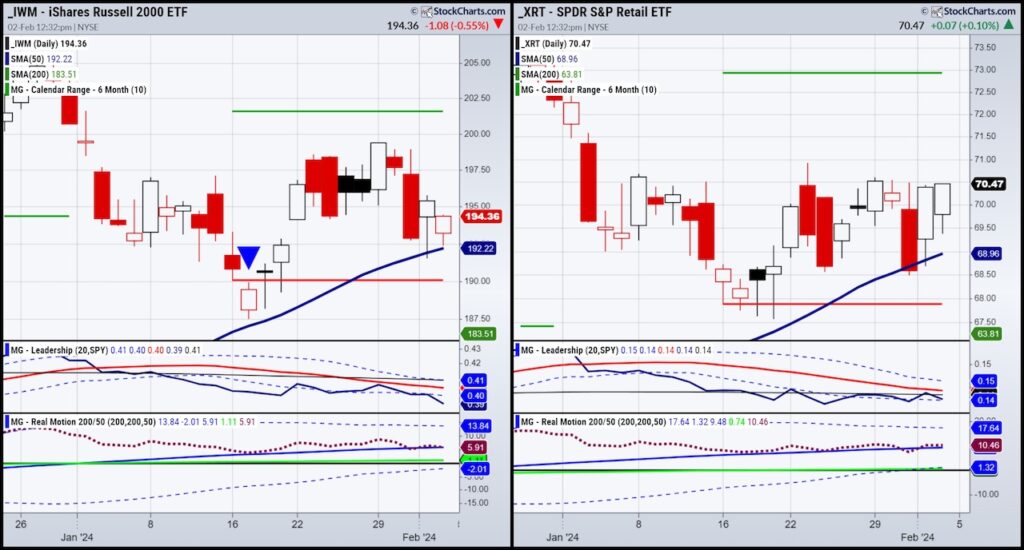
Looking at the Daily chart of IWM, we can determine a lot from the price, but also from our ACP plug-ins, featured on our website as well as on Stockcharts.com.
The price is above the 50-DMA so the bullish phase is intact. Plus, Friday was an inside day to Thursdays’ range.
The calendar range tells us that IWM can go either way. Below the January lows spells trouble, above the highs very bullish.
The Leadership has a story to tell in that it is well underperforming the SPY, which we know is unsustainable. Either SPY begins to fall or IWM must play some catch up.
Momentum or Real Motion tells us that there is no real diversion between momentum and price. We can say, IWM is lying in wait.
Granny Retail XRT looks better.
On a monthly chart, this year was banner for XRT in that it took out a 23-month moving average or went into an expansion period.
Since December, January and so far in very early February, XRT is having 2 inside months to December’s large range.
So if we step back, a move over 72.94 should be the start of something much bigger.
In the meantime, the January calendar range high remains elusive, while XRT holds well above the January calendar range low.
XRT also underperforms SPY. And momentum, like IWM’s, lies in wait, looking ok, but not showing any divergence to price.
Is Higher-For-Longer So Bad for Investors?
If normalization is reached in that inflation and fed fund rates remain aligned and the public gets used to a historically viable interest rate of 5.5%, the answer is that adaptive investors will find great opportunities.
Twitter: @marketminute
The author may have a position in mentioned securities at the time of publication. Any opinions expressed herein are solely those of the author and do not represent the views or opinions of any other person or entity.


