Gold prices have moved steadily higher and this has provided a strong tailwind to gold mining stocks.
Today, we’ll highlight a very bullish setup in this sector by looking at the Gold Miners ETF (GDX).
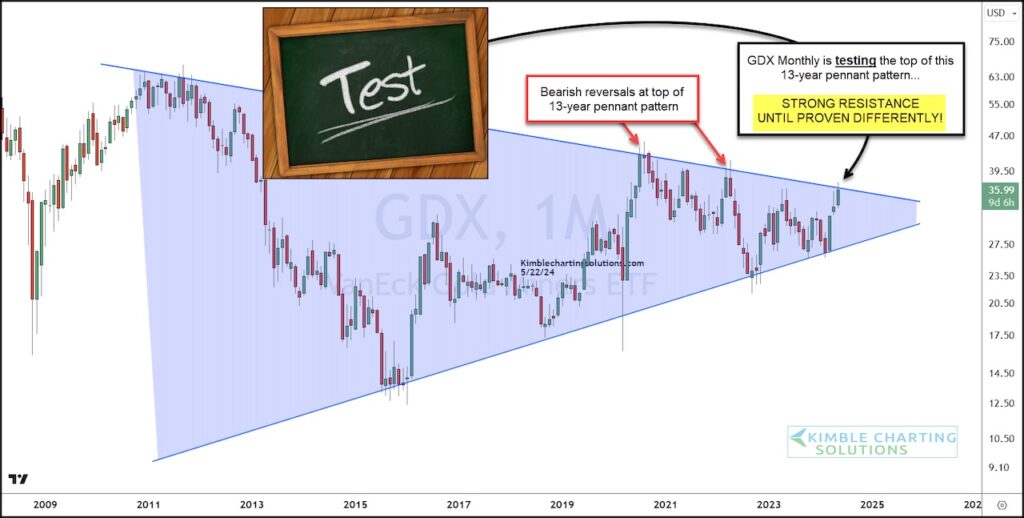
The chart below is a long-term “monthly” chart that highlights a massive triangle pattern that has developed for GDX.
And, as you can see, GDX has rallied up to the top of the triangle. This is major resistance and needs to be on every GDX bulls radar.
While a pullback would be normal here, in my humble opinion, it will be a BIG deal if/when GDX breaks out from this monster pennant pattern! Stay tuned!
Gold Miners ETF “monthly” Price Chart
Note that KimbleCharting is offering a 2 week Free trial to See It Market readers. Just send me an email to services@kimblechartingsolutions.com for details to get set up.
Twitter: @KimbleCharting
The author may have a position in mentioned securities. Any opinions expressed herein are solely those of the author, and do not in any way represent the views or opinions of any other person or entity.

: Worrisome to Broader Market?")
