After reaching up near $1400 this summer, Gold prices have declined almost 20 percent. The bear market is now over 5 years old and many investors are beginning to wonder how low Gold may go?
Nobody has the answer, but if math and psychology “work” here, it may be nearing a bottom.
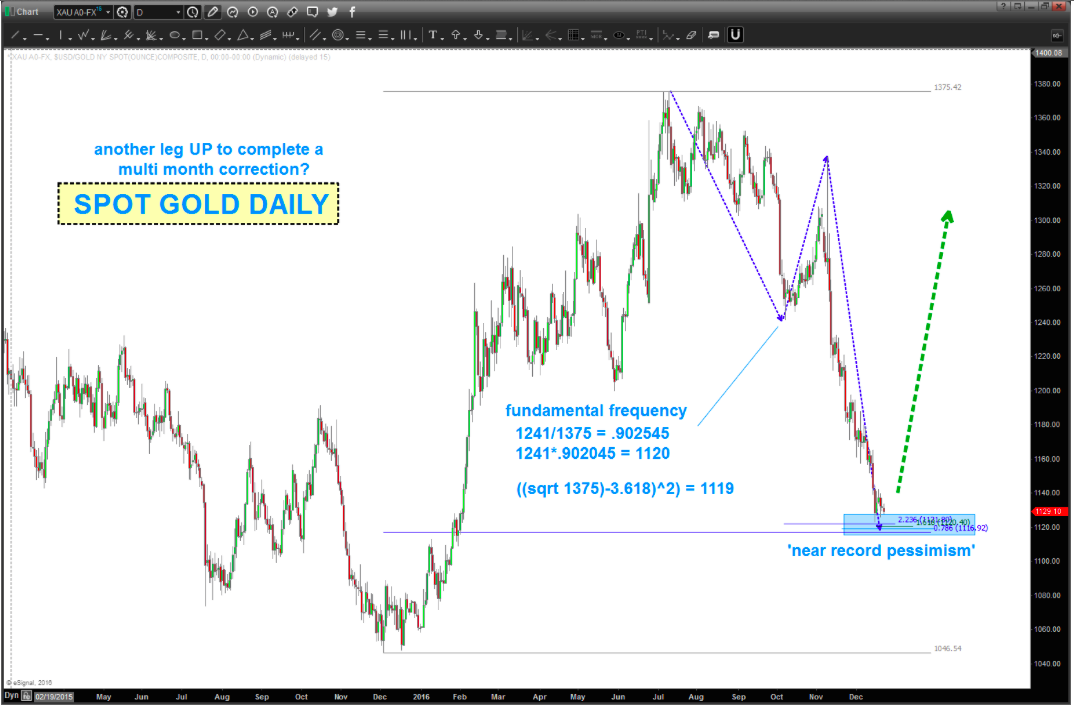
Gold Prices and Sentiment Converging
There are two key components to a potential low in Gold: A Convergence of key price support levels and near record pessimism toward Gold. This leads me to believe that another leg up is about to begin. This would complete a multi-month long correction higher from 1046.
Let’s look at the convergence of price supports just below current levels. They all reside between $1115 and $1125:
- 618 price projection (dashed blue line)
- 236 (square root of 5) price extension
- .786 Fibonacci retracement
- A square root target using a 3.618 Fibo square of 9 projection
- A fundamental frequency target (think of the rock hitting the water and making waves)
A deeper move below this level will signal that the downturn is stronger than anticipated. And a move below $1046 will negate the possibility of this pattern.
Thanks for reading.
Twitter: @BartsCharts
Author does not have a position in mentioned securities at the time of publication. Any opinions expressed herein are solely those of the author, and do not in any way represent the views or opinions of any other person or entity.


: Showing Some Signs of Emerging Strength")
