Boeing NYSE: BA seems to be in the news a ton of late.
But perhaps an even more important bit of news for investors has to do with the long-term chart of Boeing’s stock (BA).
And how this chart pattern plays out will have ramifications for $BA investors, as well as the broader market (as Boeing is a large cap in the Dow Jones Industrials Average).
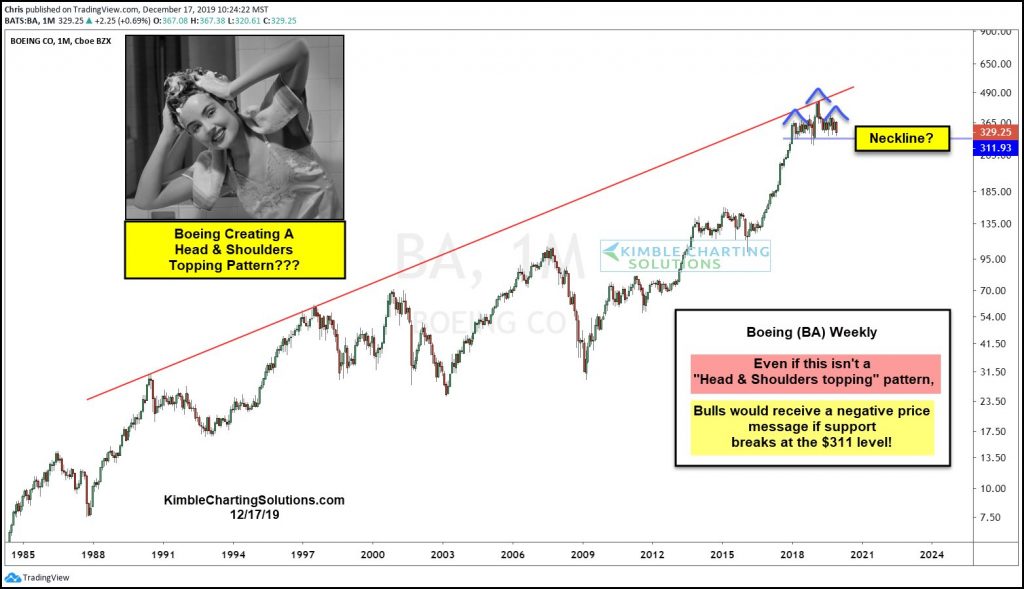
Is $BA Creating A “Head and Shoulders” Topping Pattern?
As you can see in the chart below, a potential “head and shoulders” topping pattern is in play on the “weekly” chart for Boeing (BA). And even if this is considered to be a sloppy head and shoulders pattern, the formation has the look of a potential rounded top as well. This will go from a minor concern to major concern should Boeing break down through neckline support.
With this in mind, investors should watch the $311 price support. Bulls do not want to lose that level. Stay tuned!
Boeing (BA) Long-Term Stock Chart
Note that KimbleCharting is offering a 2 week Free trial to See It Market readers. Just send me an email to services@kimblechartingsolutions.com for details to get set up.
Twitter: @KimbleCharting
Any opinions expressed herein are solely those of the author, and do not in any way represent the views or opinions of any other person or entity.

 Testing Important Price Support")
: Cup (and Maybe Handle) Watch")

