The first two months of the new year have been a tale of two stories for active investors.
The stock market surged in January, then fell back down in February. It’s true that this volatility offers trades on both sides of the market (bull/bear), but it also adds to the growing tensions… inflation, higher rates, international war, etc.
So today, we take a quick look at one of the more important stock market indices: The Russell 2000. And we use its proxy ETF for our analysis.
Why the Russell 2000? It is one of the best gauges of “risk” in the markets, measuring the performance of small cap stocks.
Note that the following MarketSmith charts are built with Investors Business Daily’s product suite.
I am an Investors Business Daily (IBD) partner and promote the use of their products. The entire platform offers a good mix of tools, education, and technical and fundamental data.
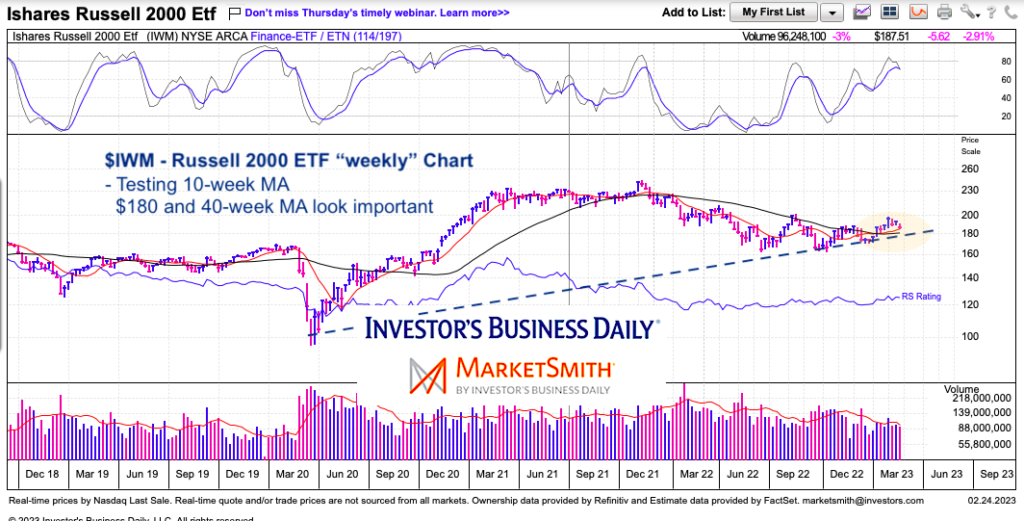
$IWM Russell 2000 ETF “weekly” Chart
The small caps are beginning to lose some momentum (see upper box with momentum turning lower). We have arrived at our initial test of the 10-week moving average. Should we lose that price support, then a test of the 40-week moving average and near-term trend line is in store around $180. In my opinion, I think $180 is an important area to watch.
Twitter: @andrewnyquist
The author may have a position in mentioned securities at the time of publication. Any opinions expressed herein are solely those of the author, and do not in any way represent the views or opinions of any other person or entity.


