The 10/2 yield curve is nearing an inflection point for investors.
In today’s chart we take a closer look at the 10/2-year yield curve with RSI applied and highlight why investors should put this on their radar.
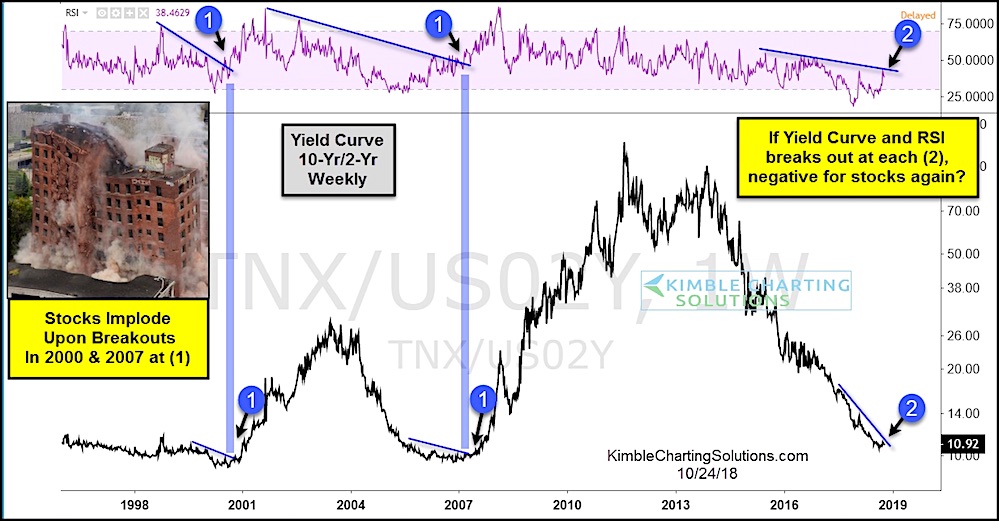
The chart spans back over 2 decades and shows two prior occasions when the 10/2 yield curve broke out to the upside (trend change) and also saw its RSI break out at points marked (1).
On both occasions, the breakout above resistance at each (1) in 2000 & 2007, saw stocks implode shortly thereafter.
We are seeing a similar situation develop here in 2018. And with stocks already under pressure, investors should be tuned in here and now.
Will it be different this time if both breakout at (2)?
10/2 Yield Curve Chart
Note that KimbleCharting is offering a 2 week Free trial to See It Market readers. Just send me an email to services@kimblechartingsolutions.com for details to get set up.
Twitter: @KimbleCharting
Any opinions expressed herein are solely those of the author, and do not in any way represent the views or opinions of any other person or entity.


