The Dow Jones Industrials Average has been navigating its way higher over the past several decades.
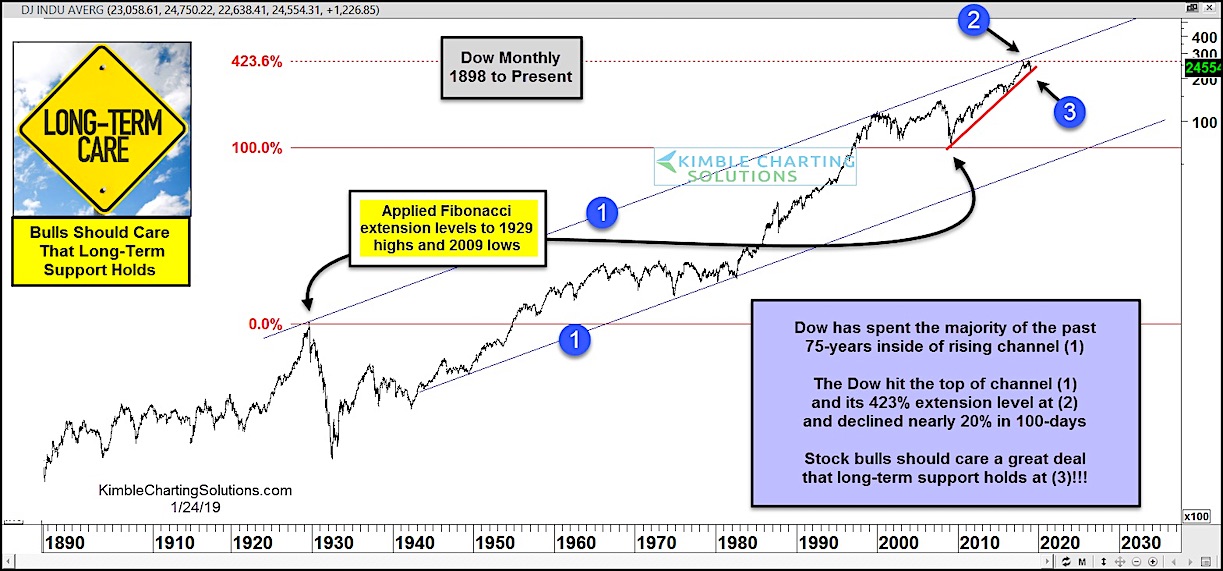
Although there have been bear markets and sharp down turns, the Dow Jones Industrials have remained within this channel – see points (1).
The top of the channel has always been formidable resistance, stalling the market out in 2000 and 2007.
Well, we reached that point again in 2018 (see point 2) and it triggered a quick and nasty correction (nearly 20 percent). But it is only a blip on this chart.
Could it turn into something more?
Note that the stall out also occurred near the 423.6% Fibonacci extension level (also at point 2). The correction took the market down to its uptrend line from 2009 (see point 3).
Needless to say, it’s probably important that long-term support holds at (3). Stay tuned!
Dow Jones Industrials Average “Monthly” Chart
Note that KimbleCharting is offering a 2 week Free trial to See It Market readers. Just send me an email to services@kimblechartingsolutions.com for details to get set up.
Twitter: @KimbleCharting
Any opinions expressed herein are solely those of the author, and do not in any way represent the views or opinions of any other person or entity.


