When I do a webinar on swing trading, one of the concepts I teach is watching good instruments that correct in bad markets.
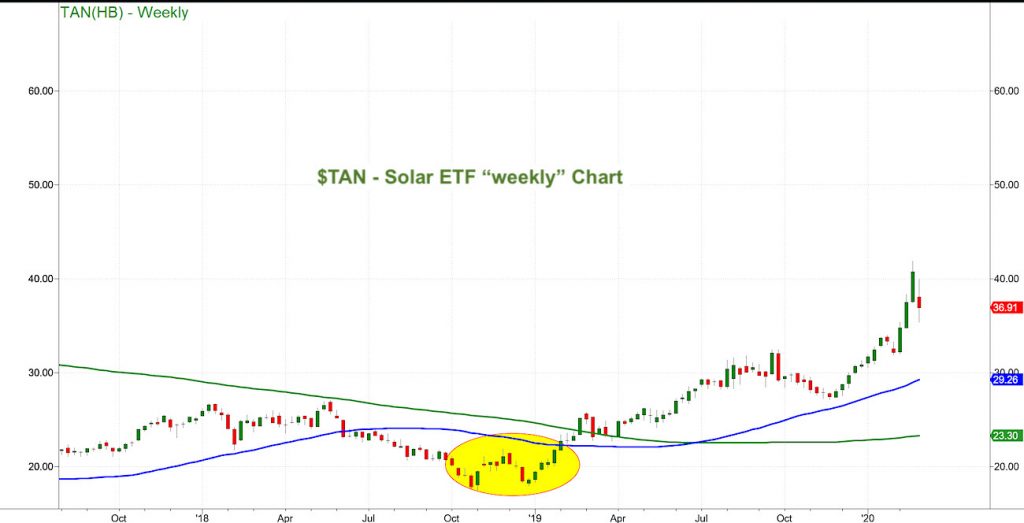
Looking at the weekly chart of the Solar Sector ETF (TAN), this is one of the top places to watch when/if the market stabilizes.
On the Daily chart, TAN must hold 34.00 and is still in a bullish phase.
On the weekly chart, after a multi-year high posted last week, this week, 37.50 must clear to get me interested.
In between, nada. But we’ll keep an eye on this one and solar stocks.
Last night I showed you a weekly chart of the Transportation Sector (IYT).
Transportation through the years, has been our “go to” for reliable information on whether the market is ready to turn back up.
Yesterday, IYT touched down on the 200-WMA (still with a positive but less so today slope) for the fourth time in 4 years.
Today, the price pierced below the 200-WMA.
That means we could see those late 2018 levels. And, once IYT clears back over 177.40, that could be it for this correction.
As far as the Solar Sector ETF (TAN), the past market corrections (especially the one you see highlighted from 2018) was a bit easier to trade because it broke below the major moving averages and then returned above them
This time, we may not have the same textbook phase change to trade.
Instead, patience is requried to ascertain a less easily definable risk. But that does not mean there is not one.
Finding, trading and managing trades such as TAN, IYT or the other countless successful swing positions we lead folks into at Marketgauge, requires a plan.
Just as I hope that I helped you navigate this down move, I hope you join me so that I can help you time your way in to the best instruments.
That could be TAN or the other great trades I have featured lately, such as VXX (volatility, the Euro FXE and our starter position in Soybeans (closed green).
S&P 500 (SPY) If closes the week over 302.15 we have an interesting setup for next week. If not, we will need to see some capitulation low.
Russell 2000 (IWM) 146.67 the 200-week moving average
Dow (DIA) Needs a capitulation reversal day
Nasdaq (QQQ) 196-198 support
KRE (Regional Banks) 48 support
SMH (Semiconductors) 124.26 the 200-DMA
IYT (Transportation) 162 best support I see til the capitulation happens
IBB (Biotechnology) Nothing is immune in this type of downdraft
XRT (Retail) 38.00-38.50 is critical support to hold for the health of retail
Volatility Index (VXX) Unconfirmed accumulation phase 21.52 pivotal
Twitter: @marketminute
The author may have a position in the mentioned securities at the time of publication. Any opinions expressed herein are solely those of the author, and do not in any way represent the views or opinions of any other person or entity.


: Showing Some Signs of Emerging Strength")
